
Pavement Life Predictor
IRC:37-2018 Mechanistic-Empirical Framework
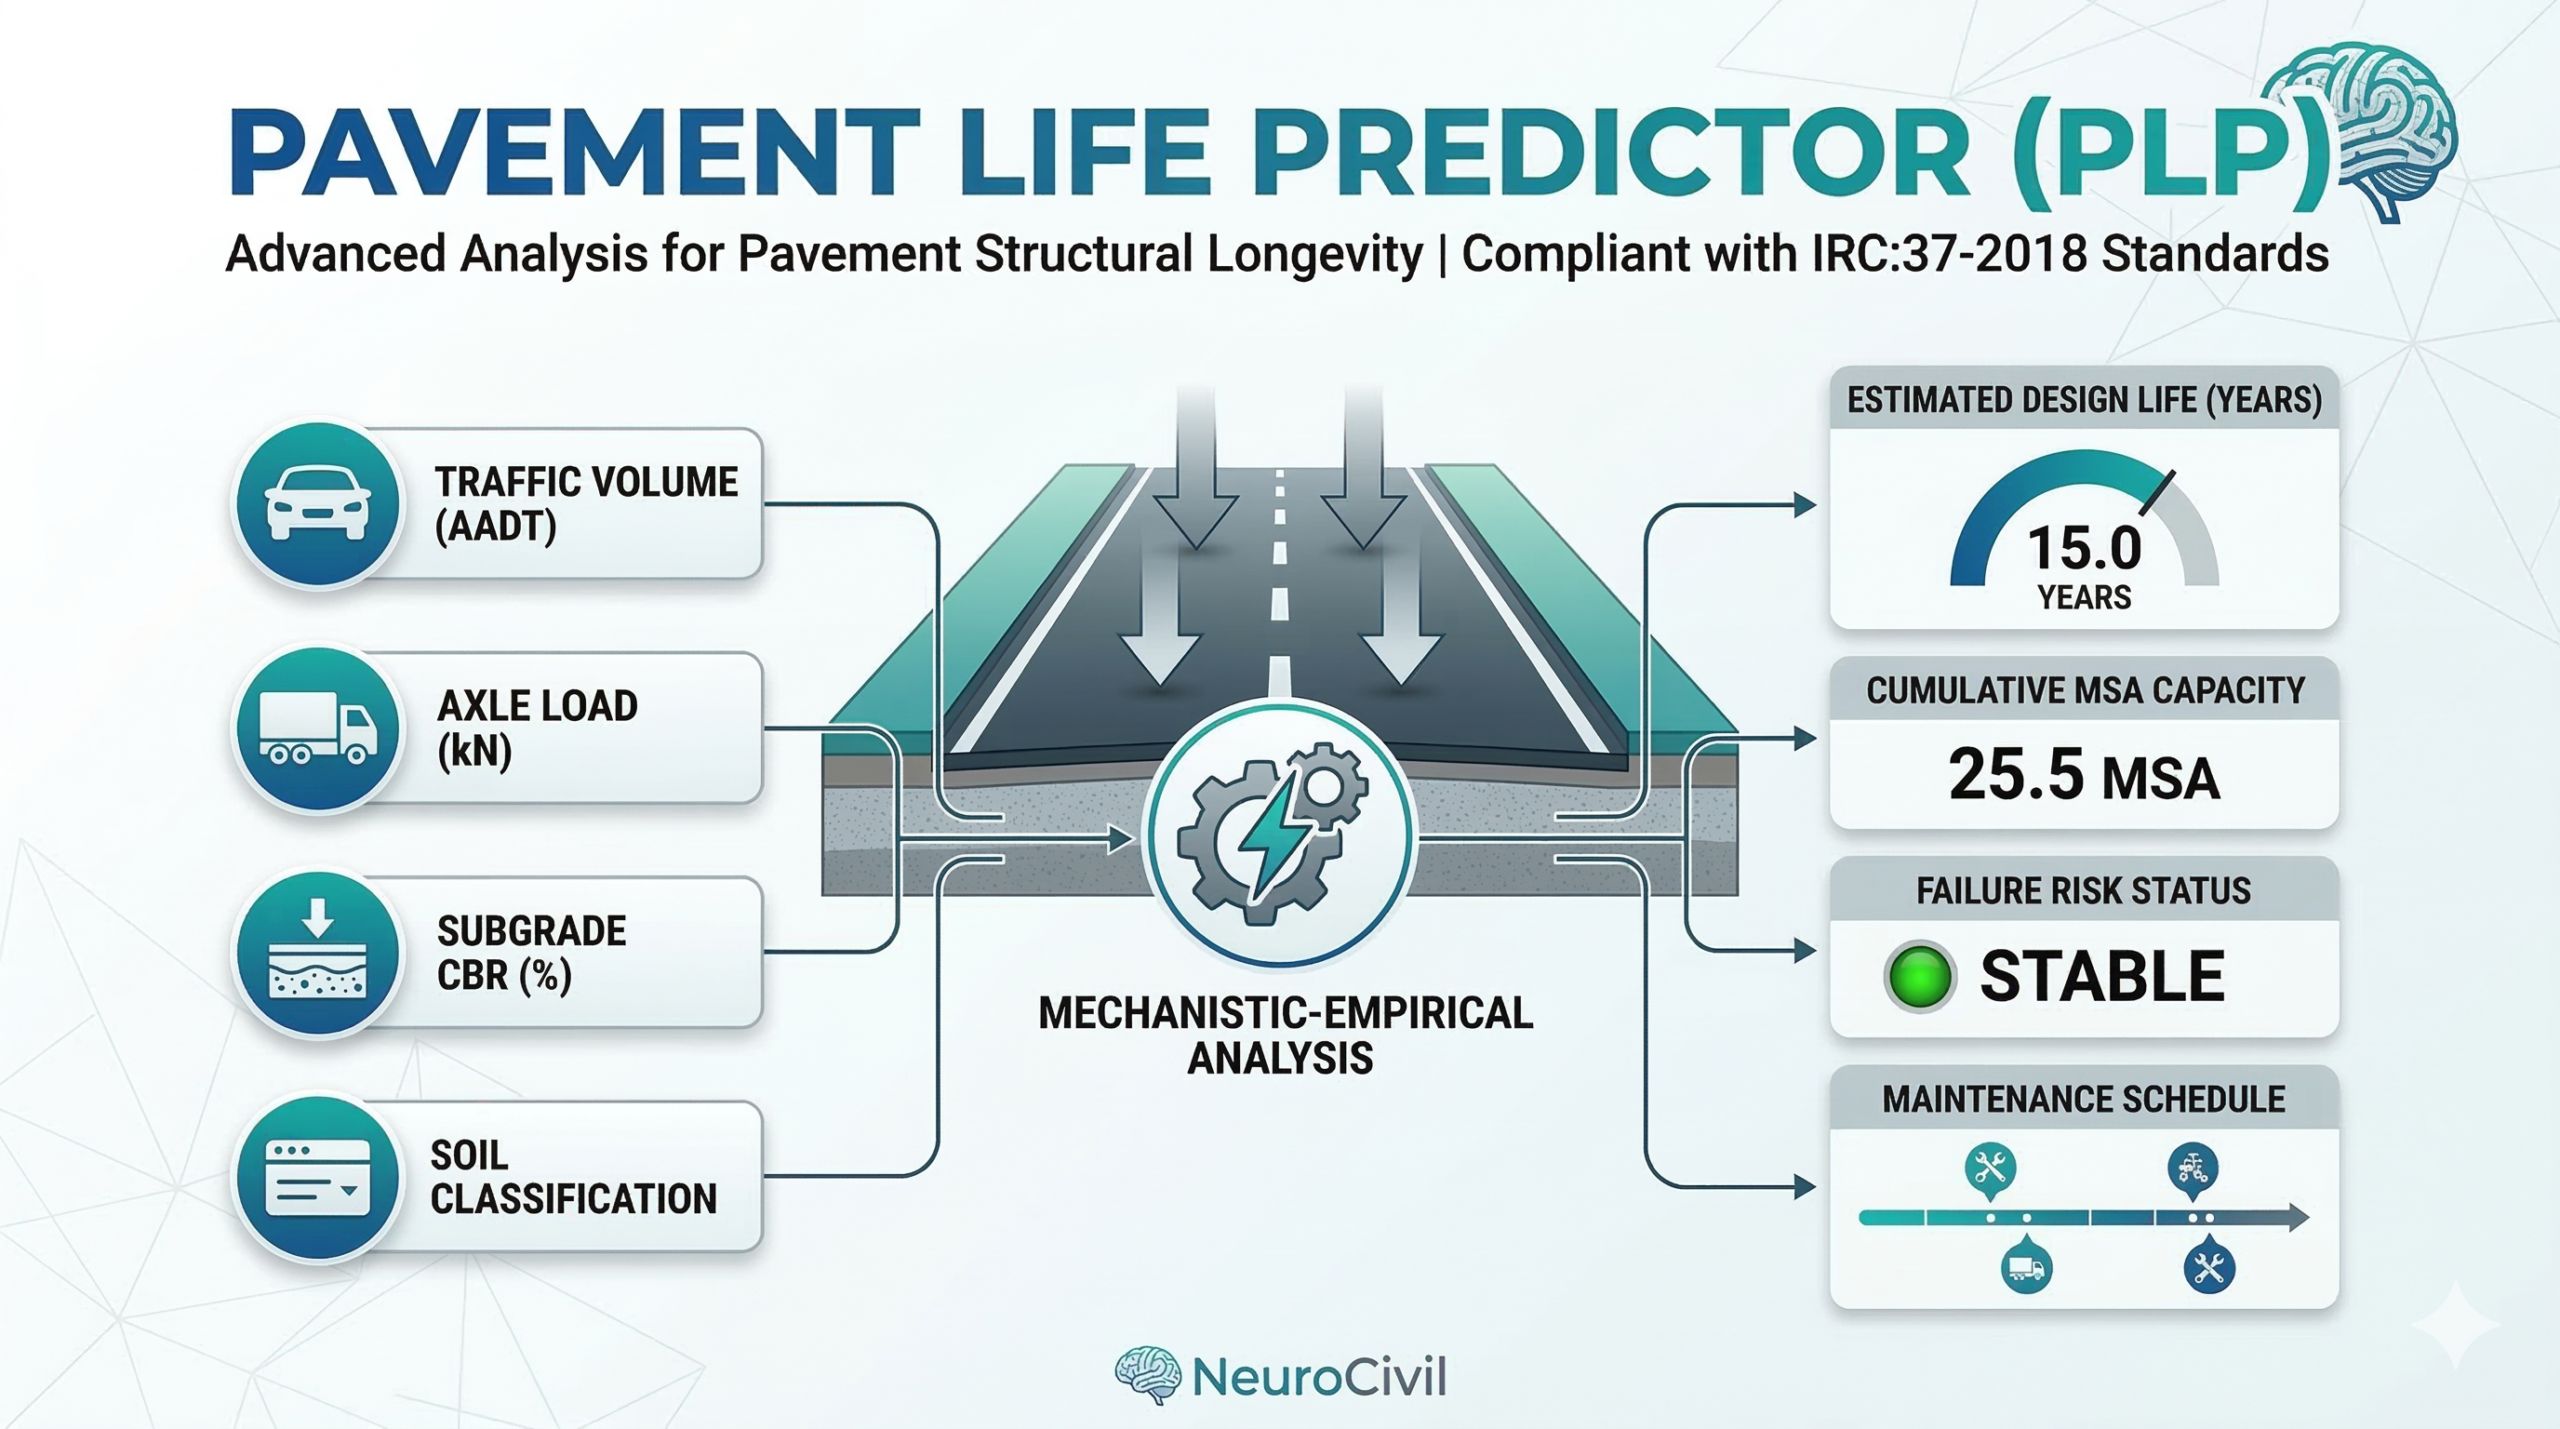
Analysis Inputs
Ready for Analysis
Provide project parameters to generate the engineering dashboard.
App Documentation: Pavement Life Predictor (PLP)
A Mechanistic-Empirical analysis tool based on IRC:37-2018 guidelines.
1. Key Features
- IRC:37 Compliance: Utilizes the Indian Roads Congress framework for flexible pavement life estimation.
- Dynamic Soil Stiffness: Automatically calculates the Resilient Modulus ($M_r$) based on Subgrade CBR and Soil Type.
- Traffic Growth Modeling: Includes a non-linear annual growth rate (5%) to solve for exact failure timelines.
- Real-time Visualization: Generates a deterioration curve showing failure probability over a 30-year span.
- Maintenance Intelligence: Suggests specific treatments (Micro-surfacing vs. DBM) based on the calculated structural health.
- PDF Reporting: One-click export for professional documentation and research sharing.
2. Engineering Methodology
The app follows a three-step mechanistic process to determine the pavement’s structural longevity:
Step A: Subgrade Characterization & Soil Impact
The foundation strength is determined via the Resilient Modulus ($M_r$). Soil classification is critical here as it determines the stiffness constant:
- Fine-Grained (Clayey): Uses $M_r (MPa) = 17.6 \times CBR^{0.64}$ (Sensitive to moisture).
- Coarse-Grained (Sandy): Uses $M_r (MPa) = 20 \times CBR$ (High particle interlock).
Step B: Strain Analysis
Using the thickness and load parameters, the app estimates the Vertical Subgrade Strain ($\epsilon_v$). This is the primary predictor for rutting failure. As thickness increases, the strain decreases exponentially, following Boussinesq’s distribution principles.
Step C: Cumulative Damage (MSA)
The structural capacity is expressed in Million Standard Axles (MSA). We utilize the IRC:37 rutting transfer function:
$N_r = 1.41 \times 10^{-8} \times (1/\epsilon_v)^{4.533}$.
3. Deterioration Modeling
The app visualizes the “Failure Probability” using a Sigmoid Logistic Function centered at the calculated design life. This models the real-world behavior where pavement damage is slow initially but accelerates rapidly as it nears its structural MSA capacity.
4. Technical Units & Definitions
| Parameter | Unit | Description |
|---|---|---|
| AADT | Vehicles/Day | Average Annual Daily Traffic for the design lane. |
| CBR | Percentage (%) | California Bearing Ratio, indicating subgrade strength. |
| Structural Capacity | MSA | Million Standard Axles the pavement can sustain before failure. |
| $\epsilon_v$ | Micro-strain | Vertical strain at the top of the subgrade. |
| $M_r$ | MPa | Resilient Modulus; a measure of material stiffness. |