
Treatment & Resource Estimator
Select all impurities (Ctrl+Click for multiple):
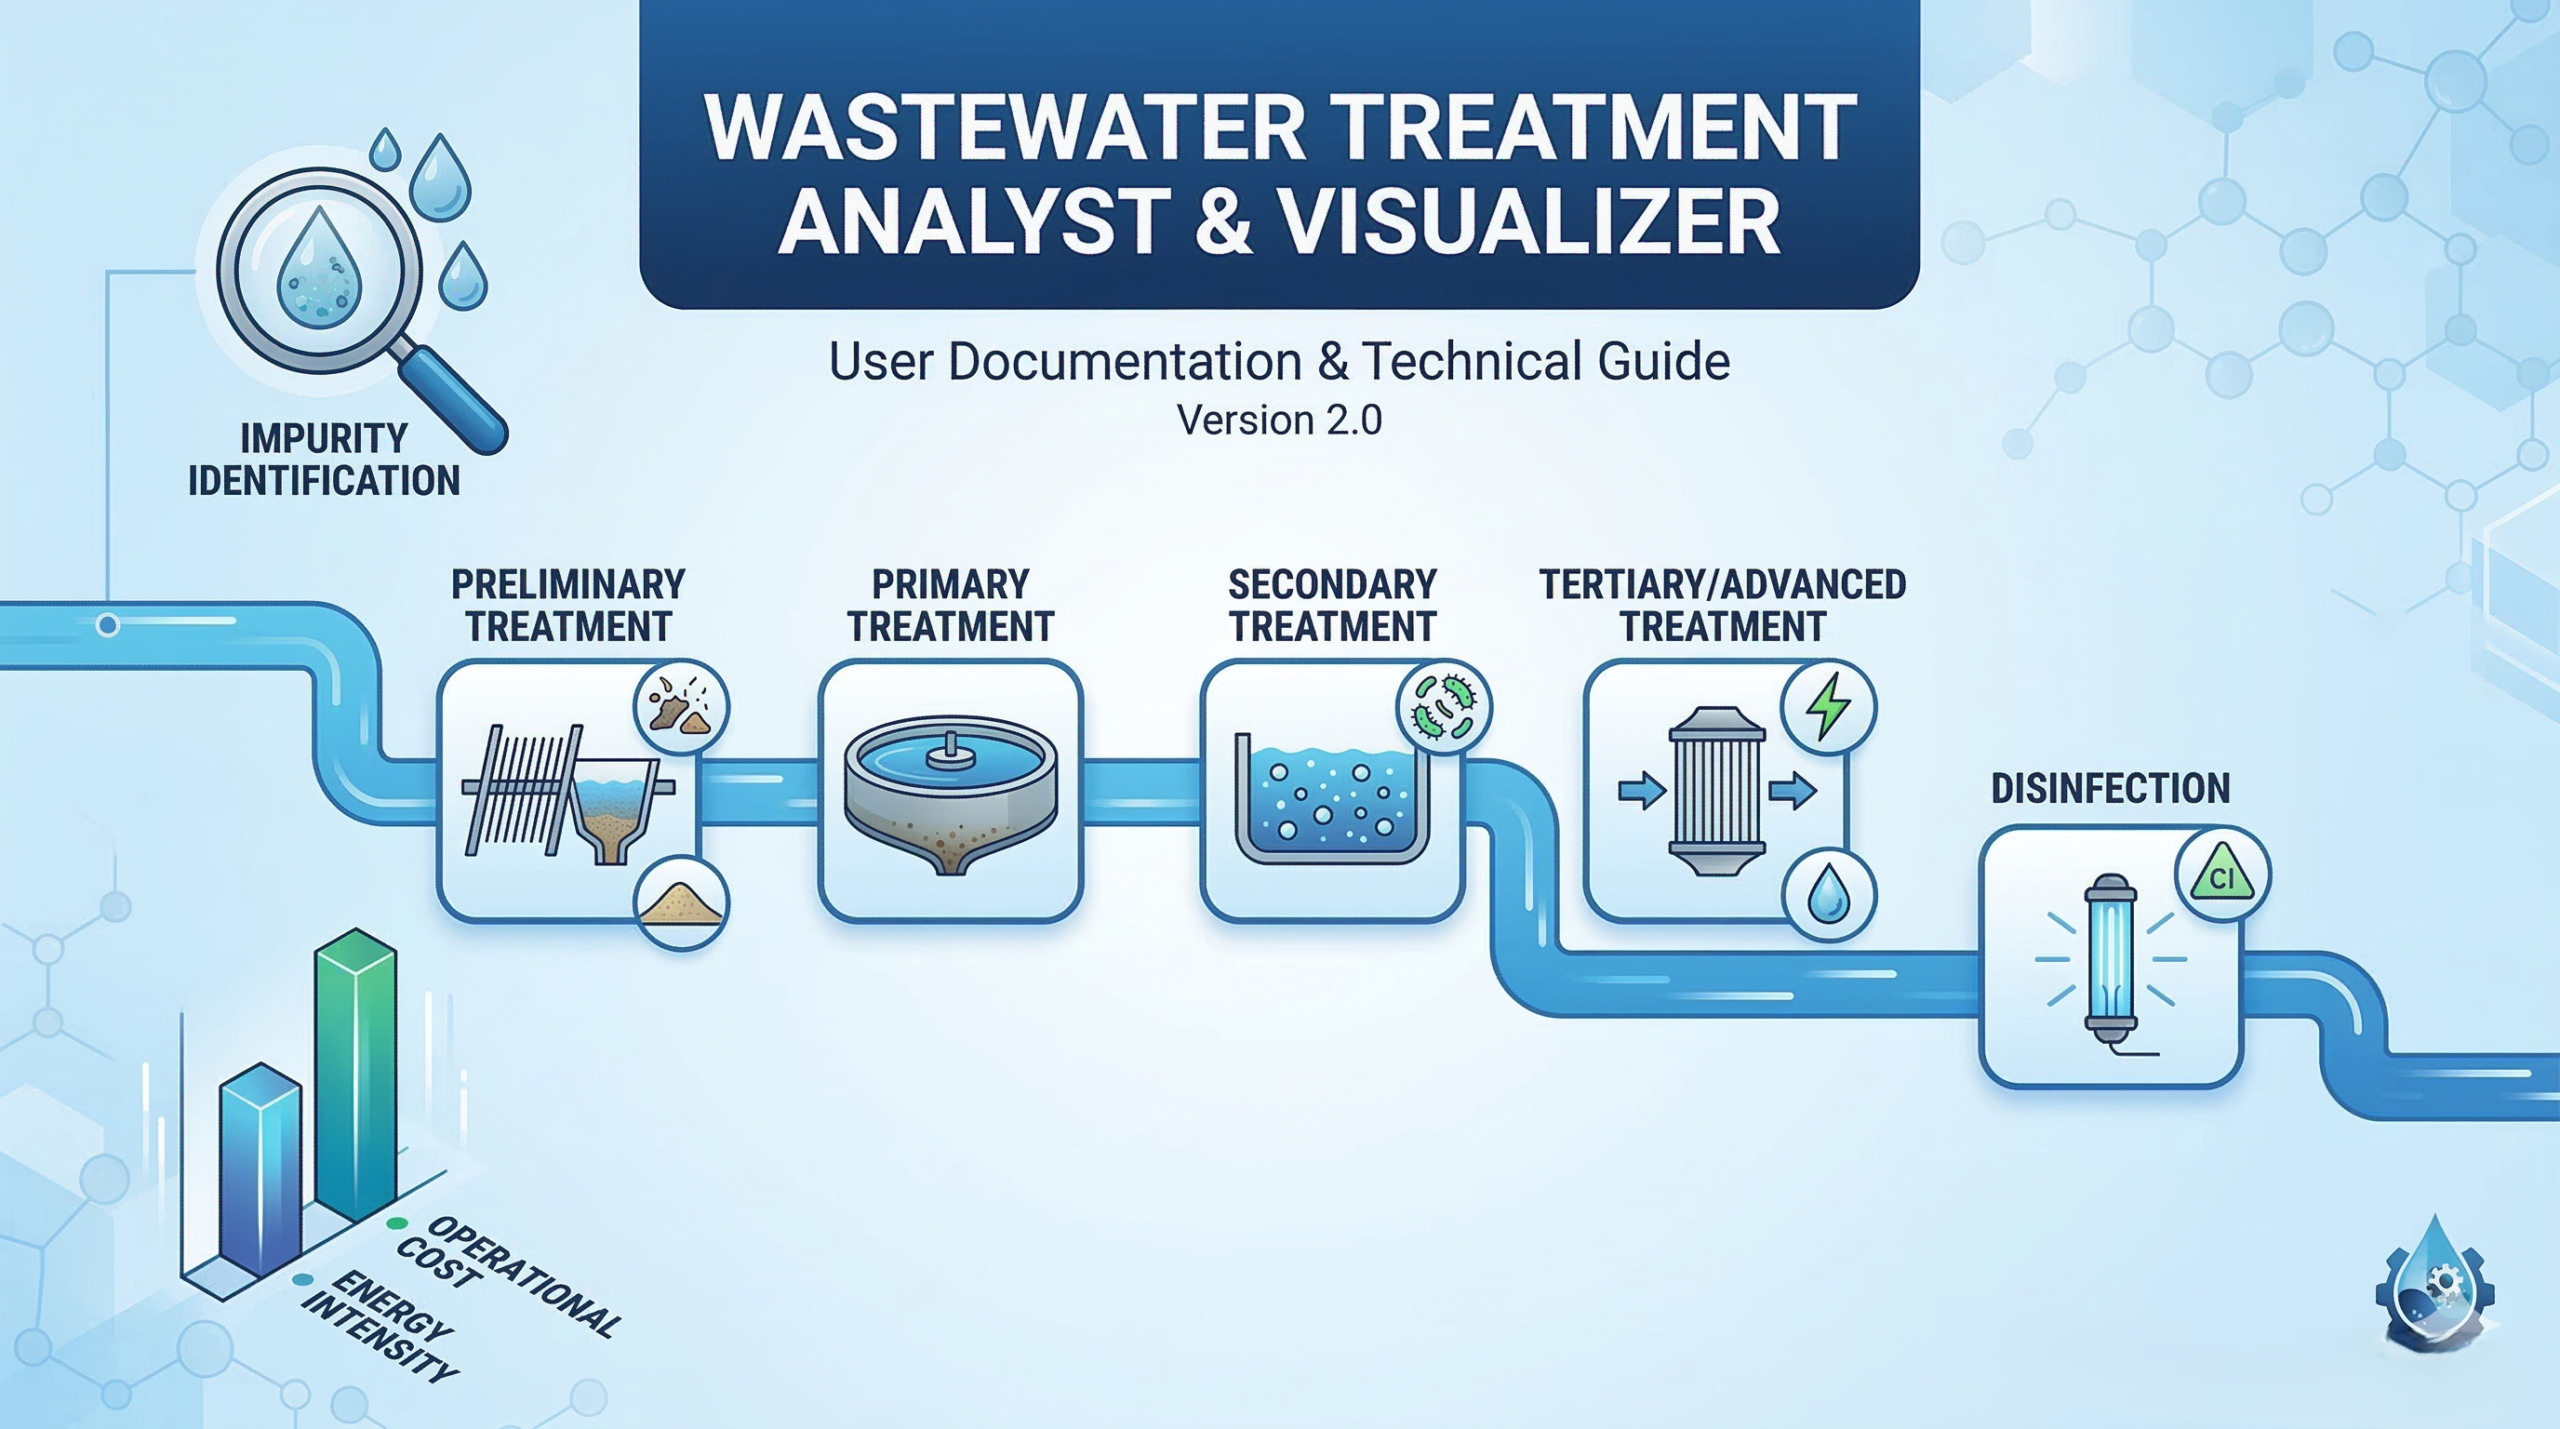
Wastewater Treatment Analyst
Version 2.0 | Technical Documentation
Responsive Web Application1. Overview
The Wastewater Treatment Analyst is a decision-support tool designed for environmental engineers, students, and facility managers. It automates the selection of wastewater treatment stages based on identified impurities and provides visual resource-impact estimations.
2. System Architecture
The application is built using a “Serverless Frontend” approach, requiring no backend installation. It utilizes:
- HTML5: Semantic structure for the interface.
- CSS3: Flexbox/Grid systems for mobile responsiveness and custom styling.
- JavaScript (ES6): Logic engine for treatment mapping and cost calculations.
- Chart.js: External library for real-time data visualization via Canvas.
- Blob API: For client-side file generation and download.
3. Treatment Logic & Weighting
The application uses a weighted scoring algorithm to determine Energy and Operational Cost (Opex). Each impurity type triggers specific treatment stages and adds a “weight” to the resource score.
| Impurity Group | Treatment Stage | Energy Weight | Opex Weight |
|---|---|---|---|
| Physical (Grit/Solids) | Preliminary / Screening | +1.0 | +1.0 |
| Suspended Solids/FOG | Primary Sedimentation | +1.5 | +2.0 |
| Organic Load (BOD) | Secondary (Biological) | +4.5 | +2.5 |
| Chemical (Metals/Nutrients) | Tertiary (Chemical) | +2.0 | +3.0 |
| Dissolved Solids (TDS) | Advanced (RO/UF) | +4.0 | +4.0 |
| Pathogens | Disinfection (UV/Ozone) | +1.0 | +1.0 |
Calculation Formula: Total Score = $\min(\sum \text{Weights}, 10)$. The result is capped at 10 to maintain a standardized 1-10 scale.
4. Key Features
4.1 Multi-Select Input
Users can select multiple impurities simultaneously using standard browser controls (Ctrl/Cmd + Click). The input is grouped into Physical, Biological, and Chemical categories for better UX.
4.2 Real-Time Visualization
Upon clicking “Analyze”, the renderChart() function destroys any existing chart instance and initializes a new Chart.js bar chart. This provides immediate visual feedback on the resource trade-offs.
4.3 Automated Report Generation
The downloadReport() function uses the following logic to create a portable document:
const blob = new Blob([reportText], { type: 'text/plain' });
const url = window.URL.createObjectURL(blob);
// Creates a temporary download link and triggers it
5. Installation & Usage
- Copy the application source code into a new file named
index.html. - Ensure you have an active internet connection (required to load Chart.js via CDN).
- Open the file in any modern web browser (Chrome, Firefox, Safari, Edge).
- Select the impurities present in your wastewater sample.
- Review the chart and treatment sequence, then download the report for your records.