

Dynamic compaction is a ground improvement technique that involves dropping a heavy weight, typically a tamper weighing between 10 to 40 tons, from a significant height, usually between 10 to 30 meters, onto the ground. This repeated impact generates shock waves that rearrange soil particles, leading to denser soil compaction.
The process is particularly useful for improving loose or unstable soil in various construction scenarios, such as on reclaimed land, airport runways, highway extensions, and industrial facilities that require stable foundations. Dynamic compaction is advantageous because it enhances existing soil rather than requiring expensive excavation and replacement, making it a cost-effective solution for increasing soil stability and strength.
After completing dynamic compaction, engineers need to verify that the ground has actually improved enough to support planned structures. In general, engineers rely on tests like the Standard Penetration Test (SPT), which measures how many hammer blows it takes to drive a standardized sampler into the soil, where the higher numbers (N-values) generally indicate stronger soil.
The drawback of this process is that it only provides data at specific test locations. What about the soil conditions between these points? Soils naturally vary across a site, and compaction effectiveness can change significantly due to differences in soil type, moisture content, and applied energy. Traditional methods using empirical charts don’t adequately account for this spatial variability.
A fascinating study conducted by Rodney Ewusi-Wilson, Junghee Park, Boyoung Yoon, and Changho Lee from the Republic of Korea using geostatistics and artificial intelligence to estimate the degree of ground improvement after dynamic compaction of Ulsan Province in South Korea. At Ulsan Province in South Korea engineers created new land for oil facilities by hydraulic filling with soils dredged from the ocean bed, followed by additional material from land sources.
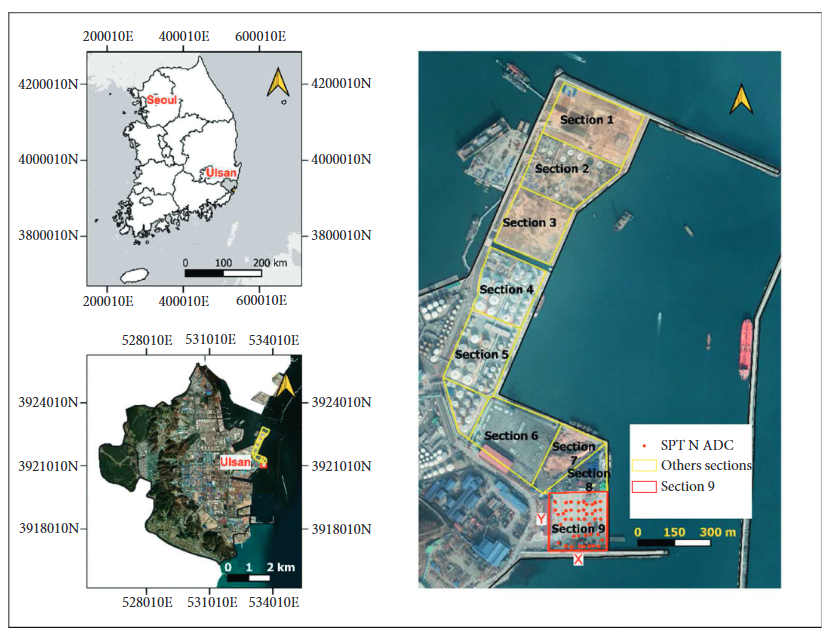
The project was massive – covering 675,400 square meters with a perimeter of 5,350 meters. Initial testing showed the reclaimed soil was predominantly loose, with SPT-N values ranging from just 2 to 32 (averaging around 14). To improve this soil, they used a primary tamper weighing 21.5 tons dropped from 20 meters, followed by a lighter 10-ton “ironing” tamper from the same height. The results show that the N-values increased to a range of 30-43 (averaging around 37), which was quite impressive.
But here’s what’s particularly interesting: not only did the absolute strength values improve, but the soil also became more uniform. The coefficient of variation (COV), which measures how much values scatter around the average, decreased from 40-60% before compaction to about 25% afterwards. This project provided excellent data for testing different evaluation methods, with 42 borehole logs after dynamic compaction and 26 logs before compaction, testing at 1.5-meter intervals down to about 17 meters deep.
The study uses two geostatistical methods, namely, Ordinary Kriging (OK) and Sequential Gaussian Simulation (SGS) that rely on semivariograms to measure spatial autocorrelation and derive interpolation weights. Meanwhile, the AI methods don’t require these statistical assumptions – they learn directly from patterns in the data.
Ordinary Kriging (OK) is a method that estimates values at unmeasured locations by analyzing how measurements relate to each other spatially. Instead of simply averaging nearby values, kriging first analyzes patterns in the data using something called a semivariogram. This semivariogram shows how similar measurements tend to be at various distances. If soil properties change gradually across a site, measurements from closer locations will have more influence on the estimate than distant ones. Kriging can also account for directional trends – for instance, if soil conditions change more rapidly in one direction than another.
While kriging provides a single “best estimate” at each location, Sequential Gaussian Simulation (SGS) generates multiple equally possible scenarios that all honour the original data. This is particularly valuable for understanding uncertainty – something traditional methods can’t provide.
Both these geostatistical methods represent significant improvements over traditional approaches because they account for spatial relationships rather than treating each test location in isolation.
Artificial intelligence methods push the boundaries even further, such as Random Forest (RF), which is a machine learning algorithm that builds multiple decision trees and combines their outputs. Think of it as consulting a “forest” of different experts and taking their collective wisdom. For spatial evaluation of bearing capacity, RF can incorporate not just coordinates but other factors that might influence soil properties – such as initial soil conditions or applied energy. It doesn’t assume any particular relationship between variables – instead, it learns patterns directly from the data.
Artificial Neural Networks (ANNs) take inspiration from the human brain, using interconnected “neurons” organized in layers to process information. ANNs excel at capturing complex, non-linear relationships – exactly what we encounter in soil behavior.
The researchers calculated the bearing capacity of the raft foundation using empirical equation (1), as shown:
qa (kPa) = 8N · Fd · (s/25.4 mm) (1)
Where:
- N is the uncorrected average SPT-N value
- Fd is a depth factor (1 + 0.33(Df/B) ≤ 1.33)
- Df is the embedded depth of foundation
- B is the width of the foundation (20m in this study)
- s is tolerable settlement (25.4mm in this study)
The researchers then used this calculated bearing capacity as the raw data for developing their geostatistical and AI models.
The performance of models was compared using metrics such as root mean square error (RMSE) and coefficient of determination (r²). The optimal Random Forest model achieved an RMSE of 15.83 for bearing capacity prediction, while the best geostatistical method (Ordinary Kriging) had an RMSE of 22.62. This suggests the AI-based approach provided significantly more accurate predictions.
The Random Forest model that performed best (RFVD) used variable-depth data, meaning it considered how soil properties changed with depth rather than just averaging values. This likely contributed to its superior performance compared to geostatistical methods.
Even more impressive was the Artificial Neural Network model for predicting the degree of improvement, which achieved an RMSE of just 0.11 and an r² of 0.97.
Advanced methods in construction significantly enhance project outcomes by improving soil condition mapping, optimizing compaction processes, reducing the need for costly field tests, and enabling better risk assessment. For instance, in a large industrial facility project on reclaimed land, AI-based evaluations allow engineers to identify specific areas needing additional compaction while avoiding unnecessary costs. In the Ulsan project, these techniques provided a more confident assessment of the site’s bearing capacity, essential for determining the load the ground can safely support.
In conclusion, the integration of geostatistics and artificial intelligence into geotechnical engineering represents a significant advancement in how we evaluate ground improvement techniques like dynamic compaction. By accounting for spatial variability and complex relationships between soil properties, these advanced methods provide more accurate, comprehensive assessments than traditional approaches.
As computational power continues to increase and more data becomes available from construction sites, we can expect AI applications in geotechnical engineering to become even more sophisticated. Future systems might integrate real-time monitoring during dynamic compaction, allowing for immediate adjustments to optimize the process.
The ground beneath our feet may seem simple, but its behavior is anything but. By embracing these advanced analytical tools, we’re not just building on firmer ground – we’re building with smarter ground improvement.
Reference
Ewusi-Wilson, R., Park, J., Yoon, B., & Lee, C. (2022). Geostatistics and artificial intelligence applications for spatial evaluation of bearing capacity after dynamic compaction. Advances in Civil Engineering, 2022(1), 7053228. https://doi.org/10.1155/2022/7053228
Mayne P. W., Jones J. S., and Dumas J. C., Ground response to dynamic compaction, Journal of Geotechnical Engineering. (1984) 110, no. 6, 757–774, https://doi.org/10.1061/(asce)0733-9410(1984)110:6(757)
Chow Y. K., Yong D. M., Yong K. Y., and Lee S. L., Monitoring of dynamic compaction by deceleration measurements, Computers and Geotechnics. (1990) 10, no. 3, 189–209, https://doi.org/10.1016/0266-352x(90)90035-t
Shahin M. A., Jaksa M. B., and Maier H. R., Artificial neural network applications in geotechnical engineering, Australian Geomechanics. (2001) 36, 49–62
Bivand R. S., Pebesma E., and Gómez-Rubio V., Interpolation and Geostatistics. Applied Spatial Data Analysis with R, 2013, Springer, Berlin, Germany, https://doi.org/10.1007/978-1-4614-7618-4
Choudhury S., Comparative study on linear and non-linear geo-statistical estimation methods: a case study on iron deposit, Procedia Earth and Planetary Science. (2015) 11, 131–139, https://doi.org/10.1016/j.proeps.2015.06.017
Shi, J., Cui, L., Gu, B., Lyu, B., Gong, S., & Gong, S. (2023). State Transition Graph-Based Spatial–Temporal Attention Network for Cell-Level Mobile Traffic Prediction. Sensors, 23(23), 9308.