

Landslides rank among the most destructive natural disasters, inflicting severe damage on infrastructure, human lives, and ecosystems. As extreme weather events become more frequent and deforestation increases, landslides are occurring more often across the globe. They happen when a slope’s stability is compromised by both natural and human factors. Geological elements such as weak soil, rock composition, fault lines, and tectonic movements, along with underground water, can diminish soil strength. Environmental triggers include heavy and prolonged rainfall, soil erosion due to deforestation, and earthquakes, which can cause sudden shifts leading to landslides. Additionally, human actions—like unplanned urban development on steep terrains, mining, and inadequate drainage systems—significantly contribute to soil instability. Given the intricate relationships among these factors, predicting landslides necessitates advanced methodologies, especially machine learning and geospatial analysis, to consider multiple variables at once.
Traditional landslide prediction methods relied heavily on geological surveys and historical data. However, modern technology has significantly transformed this approach. By combining geospatial technology with neural network models, scientists can now produce highly precise landslide susceptibility maps, enabling communities to prepare for and mitigate disasters in advance. Geospatial technology is essential in landslide prediction, providing real-time data and mapping tools that allow researchers to examine factors such as terrain, soil composition, and weather patterns. Important tools for creating landslide susceptibility maps include Remote Sensing and Geographic Information Systems (GIS). These tools support the collection and analysis of satellite images, facilitating the identification of changes in land cover, vegetation health, and soil movement, as well as real-time monitoring of areas at risk for landslides.
Digital Elevation Models (DEM) are vital for offering 3D terrain representations, assessing slope gradients and elevation levels to evaluate potential landslide occurrences based on these elevation patterns. The Normalized Difference Vegetation Index (NDVI) measures vegetation density and health, assisting in evaluating deforested or degraded regions that may be at risk for landslides and tracking land cover changes over time. By merging geospatial data with machine learning algorithms, scientists can develop predictive models that produce highly accurate landslide risk assessments, greatly improving preparedness and response strategies.
This article explores a study conducted by Saurabh Kumar Anuragi and D. Kishan from the Department of Civil Engineering at the Maulana Azad National Institute of Technology in Bhopal, India. The findings were published in the American Journal of Geospatial Technology and explore the application of Multi-Layer Perceptron Neural Networks (MLPNN) and geospatial tools in enhancing landslide prediction capabilities.
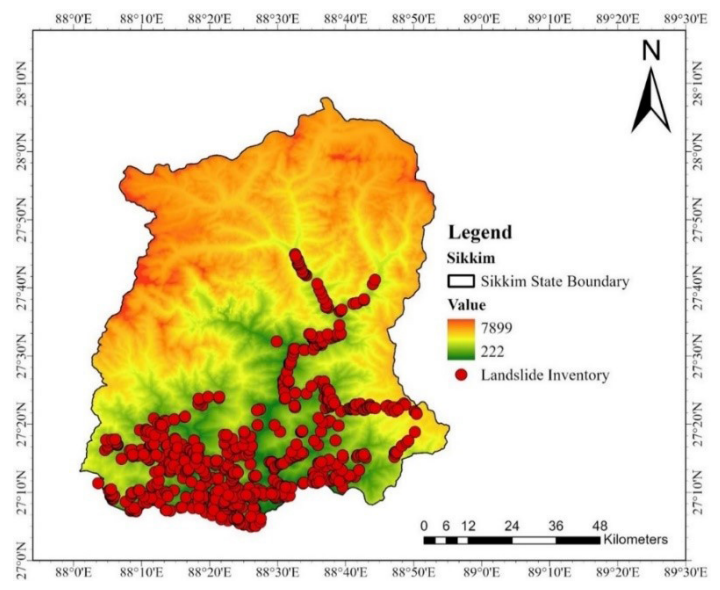
The focus of the study is on Sikkim, a strategically significant state located in the northeastern Himalayas of India. Encompassing an area of 7,096 km2, Sikkim is characterized by its diverse landscapes and dynamic mountainous terrain. The capital, Gangtok, is noteworthy for its varied elevations and climatic conditions, which range from tropical to alpine. As of the 2011 census, the state has a population density of 86 individuals per square kilometre, facing challenges in urban development due to rapid population growth, particularly in Gangtok, which has led to issues such as traffic congestion and housing shortages.
Geologically, Sikkim is distinguished by notable mountain structures, including the Main Central Thrust and Main Boundary Thrust zones, indicating a complex geological evolution. Additionally, the region is classified as Zone IV on India’s Seismic Zoning Map, underscoring the imperative for earthquake preparedness and sustainable urban planning.
To conduct the analysis the authors identified nine critical factors that contribute to the triggering of landslides, which are essential for understanding and mitigating these natural events are as follows:
- Aspect (Slope direction) – Determines the influence of sun exposure and rainfall on slope stability.
- Elevation – Higher altitudes may increase or decrease landslide risks depending on soil composition.
- Land Use/Land Cover (LULC) – Deforestation, urbanization, and agriculture impact slope stability.
- NDVI (Vegetation Index) – Measures how much vegetation is present (higher vegetation = more stability).
- Rainfall – Heavy rains weaken soil structure, making slopes prone to landslides.
- Slope Gradient – Steeper slopes are more vulnerable to landslides.
- Soil Type – Different soil compositions have varying abilities to absorb water and resist erosion.
- Earthquake Activity – Tremors can trigger landslides in already unstable slopes.
- Lithology (Rock Composition) – Determines how well the ground resists weathering and erosion.
To create a dataset, the authors gathered a landslide inventory comprising 693 landslide samples and 695 non-landslide samples from Bhukosh, Geological Survey of India (GSI). This dataset was then divided into 70% for training and 30% for testing purposes. The analysis examined various activation functions, specifically ReLU (Rectified Linear Unit), Logistic (Sigmoid Function), Tanh (Hyperbolic Tangent), and Identity (Linear Activation). A comparative analysis was conducted to evaluate how these functions affect model performance, using metrics such as kappa, sensitivity, specificity, and AUC. The results deepen understanding of machine learning models and offer insights for enhancing methodologies in this domain. The hyperparameter settings used in the analysis are detailed as follows:
- solver = adam
- activation = relu; logistic; tanh; identity
- hidden layer = [50,50,50,50,50]
- max_iter = 500
- learning_rate = adaptive
- learning_rate = 0.01
The performance of various machine learning models was rigorously compared using multiple metrics to assess their effectiveness in distinguishing between landslide-prone and stable areas. One of the key metrics analyzed was the Area Under the Curve (AUC), which provides insight into the models’ ability to correctly classify instances. The AUC values for the models were as follows: MLPNN_logistic achieved an AUC of 0.757, making it the most effective model in this regard. The MLPNN_relu model followed closely with an AUC of 0.751, while MLPNN_tanh recorded an AUC of 0.750, indicating its similar utility. The least successful in terms of AUC was the MLPNN_identity, with a value of 0.736.
In terms of performance metrics, the MLPNN_relu model demonstrated a commendable balance between its training and testing scores, which were 0.742 and 0.740, respectively. Additionally, it exhibited high sensitivity, with a value of 0.908, reflecting its strong capability to identify true positive instances (i.e., landslide-prone areas). However, this model had lower specificity at 0.594, suggesting that it struggled to accurately identify true negatives (i.e., stable areas).
Conversely, the MLPNN_logistic model distinguished itself by attaining the highest kappa value of 0.504, an indication of good agreement between predicted and observed classifications. This model recorded training and testing scores of 0.760 and 0.748, respectively. It also demonstrated substantial sensitivity at 0.883, alongside a specificity of 0.631, underscoring its robustness in categorizing the data accurately.
The MLPNN_tanh model displayed consistent performance with training and testing scores of 0.745 and 0.741, respectively. It achieved a sensitivity of 0.875, indicating a strong capacity to identify landslide-prone areas, but had a slightly lower specificity at 0.624.
Lastly, the MLPNN_identity model, while achieving the highest specificity at 0.673, recorded the lowest sensitivity at 0.798. This resulted in a kappa value of 0.466, highlighting its diminished effectiveness in accurately identifying landslide-prone areas compared to the other models. Overall, the comparison of these models elucidates their varying strengths and weaknesses in identifying landslide susceptibility.
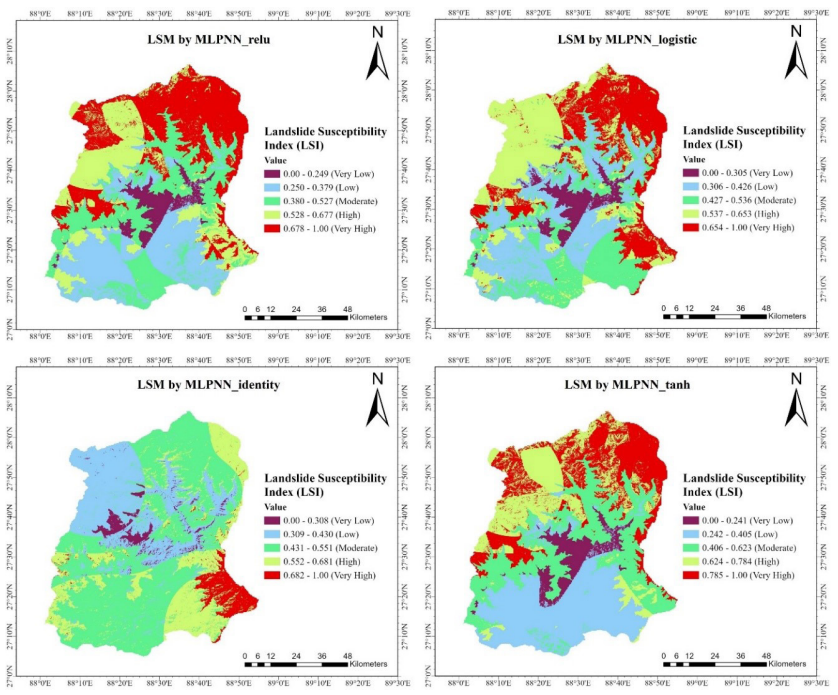
Furthermore, the study classifies the landslide susceptibility maps into distinct categories, thereby facilitating the identification of high-risk areas for the implementation of effective mitigation strategies. The spatial distribution of these classifications—very low, low, moderate, high, and very high—differs across various machine learning models. The MLPNN_relu model indicates that 26.79% of the study area is classified as having “very high” susceptibility, while only 5.74% is deemed “very low.” In the MLPNN_logistic model, the “high” category is the most prevalent at 25.96%, whereas “very low” is the least prevalent at 6.27%, suggesting a balanced focus in classification. The MLPNN_tanh model reveals that 27.46% of the area is categorized as having “low” susceptibility, with “very low” at 6.42%.
Conversely, the MLPNN_identity model tends to classify more terrain as having lower susceptibility, with the “moderate” category representing 46.81% and the “very low” category making up only 3.07%. This analysis underscores the influence of activation functions and model parameters on landslide susceptibility maps. Among the models examined, MLPNN_logistic and MLPNN_relu are identified as the most effective, with logistic activation exhibiting a slight overall advantage over ReLU. Nevertheless, ReLU is preferred due to its heightened sensitivity in mitigating false negatives when identifying landslide-prone areas.
The integration of geospatial technology and neural networks is fundamentally transforming the field of landslide prediction. This research demonstrates that the Multi-Layer Perceptron Neural Network (MLPNN) employing logistic activation functions yields the highest accuracy and reliability in landslide susceptibility mapping, thereby assisting communities in their preparedness for disasters prior to their occurrence. As technological advancements persist, the amalgamation of artificial intelligence-driven predictive modelling with real-time geospatial monitoring is poised to significantly mitigate the catastrophic effects of landslides on a global scale.
Reference
Anuragi, S. K., & Kishan, D. (2025). Landslide Prediction and Mapping through Geospatial and Neural Network Approach. American Journal of Geospatial Technology, 4(1), 11–21. https://doi.org/10.54536/ajgt.v4i1.4122
Afroz, T., Miah, M. G., Abdullah, H. M., Islam, M. R., & Rahman, M. M. (2022). Monitoring of LULC Changes and Forest Loss Using Geospatial Technique: A Case Study from Northern Region of Bangladesh. American Journal of Geospatial Technology, 1(2), 1–9. https://doi.org/10.54536/ajgt.v1i2.907
Bopche, L., & Rege, P. P. (2022). Landslide Susceptibility Mapping: An Integrated Approach using Geographic Information Value, Remote Sensing, and Weight of Evidence Method. Geotechnical and Geological Engineering, 40(6), 2935–2947. https://doi.org/10.1007/s10706-022-02070-4
Kavzoglu, T., & Teke, A. (2022). Predictive Performances of ensemble machine learning algorithms in landslide susceptibility mapping using random forest, extreme gradient boosting (XGBoost) and natural gradient boosting (NGBoost). Arabian Journal for Science and Engineering, 47(6), 7367-7385. https://doi.org/10.1007/s13369-022-06560-8
Ramana Murty, M. V., Ravi Kumar, C., Srinivasu, K., Kannan, R., & Sundar, B. (2023). Monitoring of Coastal Geo-Environment for Hazard Mitigation: A Case Study of Machilipatnam Region, Andhra Pradesh, India. American Journal of Geospatial Technology, 1(2), 27–38. https://doi.org/10.54536/ajgt.v1i2.1381