

Landslides pose a significant hazard with the potential to inflict substantial damage on property, disrupt critical infrastructure, and risk lives, particularly in mountainous regions such as those found in Korea. These natural disasters are frequently triggered by heavy rainfall, especially during typhoons, which can lead to soil saturation and slope destabilization. Approximately 70% of Korea’s land is mountainous, making it particularly vulnerable to large-scale landslides, especially when accompanied by thunderstorms and torrential downpours.
Historically, severe weather events, including Typhoons Yanni (1998), Rusa (2002), Maemi (2003), and Ewinia (2006), have resulted in significant rainfall and consequent landslide occurrences throughout Korea. For instance, during Typhoon Yanni in August 1998, 511 landslides were reported in Jangheung (with 588 mm of rainfall), 788 in Sangju (522 mm), and 283 in Pohang (150 mm). Similarly, in August 2002, 984 landslides were recorded in Gangneung (984 mm), and in August 2006, there were 748 landslides in Pyeongchang (898 mm). Between the years 1997 and 2010, there were approximately 204 casualties attributable to landslides in Korea. In light of these challenges, it is essential to develop accurate susceptibility mapping to identify regions at risk, thereby enabling the formulation of effective risk mitigation strategies.
Landslide susceptibility mapping can be classified into four primary techniques: statistical, probabilistic, deterministic, and heuristic. The statistical technique focuses on selecting and analyzing factors that influence landslides in areas with environmental conditions similar to those where past landslides have occurred. The probabilistic technique involves the collection of historical landslide data, the construction of a database, and the creation of landslide inventory or susceptibility maps. The deterministic approach is based on the principles of physical conservation laws and necessitates the development of maps that represent spatial distributions. Lastly, the heuristic technique employs aerial photographs or field survey data to generate mapping outputs.
Recent advancements in technology have significantly enhanced prediction models by integrating Geographic Information Systems (GIS) and Artificial Intelligence (AI) methodologies. GIS facilitates the collection, analysis, and visualization of spatial data, while AI enhances this process by analyzing vast datasets to uncover patterns and trends that may not be immediately observable. Prior studies have implemented various machine learning models, including fuzzy logic, artificial neural networks (ANN), and neuro-fuzzy logic. These models have demonstrated substantial improvements compared to traditional techniques in assessing landslide susceptibility.
Landslide susceptibility maps help identify areas prone to landslides, allowing policymakers, engineers, and urban planners to take preventive measures. These maps integrate various factors, including topography, soil characteristics, hydrology, vegetation cover, and land use, to assess risk levels. With climate change increasing the frequency of extreme weather events, the occurrence of landslides is expected to rise. Studies indicate that deforestation, urbanization, and land-use changes exacerbate this risk. Thus, having an accurate landslide susceptibility map is essential for minimizing damage and protecting communities. By leveraging advanced geospatial tools, researchers can assess and forecast landslide hazards with greater precision.
A study conducted by a team of researchers from Pukyong National University in the Republic of Korea focused on landslide susceptibility mapping for Gangwon Province. The research was published in the Journal of Environmental Earth Sciences in August 2012. The province occupies a total area of 16875 km², representing 17% of the national territory, making it the second-largest province in Korea. It is predominantly a mountainous region, with 50-60% of the rainfall occurring in summer, the maximum of which reached 1,035 mm in 2008. The study area contains numerous valleys trending north-northeast, primarily shaped by large faults that weaken the ground. Geologically, it features Precambrian gneisses and Mesozoic granites. Intense fault activity has resulted in surface discontinuities and broken bedrock sloping in various directions. Additionally, many mountainous areas have steep slopes (over 30 degrees) that are prone to slope failure.
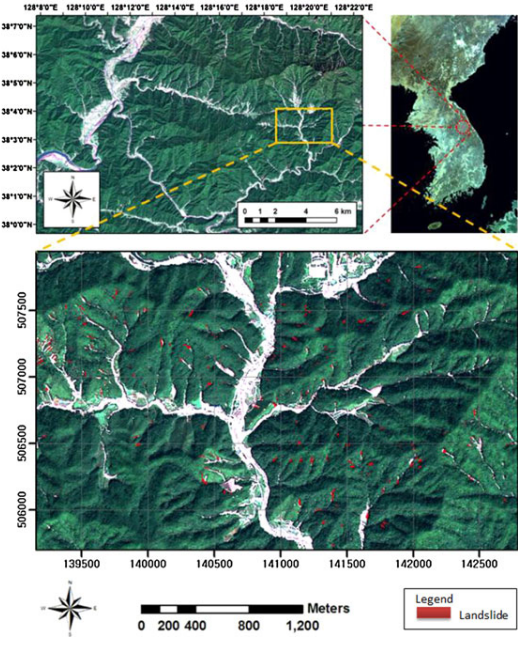
To establish a comprehensive landslide inventory, the authors undertook a detailed project involving the collection of 466 images through aerial photography. This imagery was rigorously analyzed using the ERDAS Leica Photogrammetry Suite (LPS) to achieve a spatial resolution of 50 centimeters. From this collection, a total of 708 landslide events were identified, with sizes ranging from 6 to 3,994 m2.
The photographs served as a vital resource for extracting 13 significant factors that contribute to landslide occurrences. These factors include elevation, slope, aspect, distance to drainage, stream power index (SPI), topographic wetness index (TWI), soil texture, soil effective thickness, tree type, tree diameter, tree age, crown density, and land use/land cover.
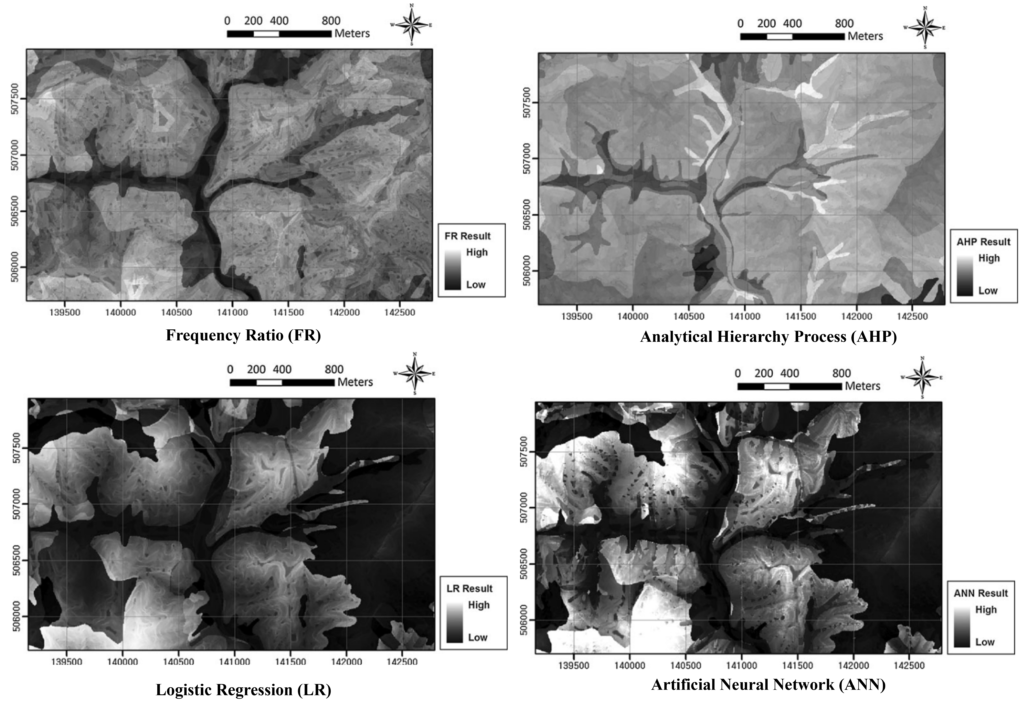
With this robust dataset, the authors employed several advanced analytical techniques, including frequency ratio (FR), analytical hierarchy process (AHP), logistic regression (LR), and artificial neural networks (ANN). The FR method utilizes a probability-based approach to examine the relationship between historical landslides and the identified factors through GIS overlay techniques. AHP serves as a structured multi-criteria decision analysis tool that assigns weights to the different influencing factors using pairwise comparison matrices.
Logistic regression provides a statistical framework to predict landslide occurrences based on various environmental variables, while ANN applies a multi-layer perceptron (MLP) model with backpropagation training to explore complex, nonlinear relationships present in the data.
To evaluate the risk associated with landslides in specific areas, the authors developed a landslide susceptibility index (LSI). This index ranges from 0 to 1, where 0 indicates a low risk zone and 1 signifies a high risk zone. This comprehensive approach aims to deepen the understanding of landslide dynamics and enhance decision-making processes related to land use and risk management.
The models were developed and their performance evaluated using the Area Under the Curve (AUC) metric. The results indicated the following AUC values: Artificial Neural Network (ANN) = 0.806, Fuzzy Logic Regression (FR) and Linear Regression (LR) = 0.794, and Analytical Hierarchy Process (AHP) = 0.789. These findings demonstrate that the ANN model outperformed the other models, indicating strong generalization capabilities.
Furthermore, it was identified that areas with steep slopes exceeding 22 degrees, regions characterized by sandy loam soil, and zones located near drainage channels are particularly susceptible to landslides. The role of vegetation was also significant; mixed and coniferous forests exhibited a higher probability of landslides compared to hardwood forests, highlighting the influence of vegetation on slope stability.
A correlation analysis was performed among the FR, AHP, LR, and ANN models utilizing Landslide Susceptibility Index (LSI) maps. The results revealed notable correlations, with the LR and ANN models demonstrating a strong correlation coefficient of 0.829, followed closely by a coefficient of 0.821 between AHP and ANN, and 0.812 between AHP and LR. The correlation coefficients were measured at 0.763 between FR and LR, 0.693 between FR and ANN, with the lowest correlation observed at 0.619 between the AHP and FR models.
As climate change and urbanization increase landslide risks, integrating AI and GIS for landslide susceptibility mapping is a game-changer. The study in Korea demonstrates that ANN models offer superior accuracy and reliability, making them a valuable tool for landslide risk assessment worldwide. Governments, researchers, and policymakers should invest in AI-driven solutions to enhance disaster resilience and safeguard communities. Future developments in hybrid modeling and real-time monitoring will further refine landslide prediction, ensuring more robust and proactive disaster management strategies.
Reference
Park, S., Choi, C., Kim, B. et al. Landslide susceptibility mapping using frequency ratio, analytic hierarchy process, logistic regression, and artificial neural network methods at the Inje area, Korea. Environ Earth Sci 68, 1443–1464 (2013). https://doi.org/10.1007/s12665-012-1842-5
CRED (2009) Centre for Research on the Epidemiology of Disasters (CREM) website. http://www.dmdat.be/
Lee HW (2011) Analysis of landslide susceptibility using probabilistic method and GIS. Sejong university, mater’s thesis (in Korean)