

On a monsoon morning in June 2013, the serene hills of Uttarakhand turned into a nightmare. A heavy rainfall triggered massive landslides and floods that killed thousands of people and left 75,000 pilgrims stranded in the mountains. The disaster exposed a harsh reality as India had no comprehensive system to predict where landslides might strike next.
Fast forward to today, and researchers at the Indian Institute of Technology, Delhi have developed something that could change this story by developing India’s first national-scale, high-resolution landslide susceptibility map, created using the power of big data and machine learning. Let me walk you through how they did it, and why it matters for millions of people living in India’s mountainous regions.
The Landslide Problem in India
India is particularly vulnerable to landslides. From the towering Himalayas in the north to the Western Ghats running along the southwest coast, about 12.6% of the country’s land area is prone to these devastating events. Between 2001 and 2021, landslides killed an average of 847 people each year and caused $0.3 billion in annual losses.
Think about it this way: if you’ve ever driven on mountain roads during the monsoon season, you’ve probably seen “Landslide Zone” signs warning you to speed up or avoid parking. But these warnings are often based on past incidents or expert judgment rather than comprehensive scientific analysis. What if we could predict with high accuracy which hillsides are ticking time bombs, waiting for the next heavy rainfall to trigger a catastrophe?
What Makes Landslides So Hard to Predict?
Landslides aren’t random events; they happen when multiple factors align in just the wrong way. Imagine a hillside as a delicate balance of forces. Gravity is constantly pulling soil and rocks downward, while friction and the strength of the materials hold everything in place. When this balance tips, disaster strikes.
The challenge is that dozens of factors influence whether a slope will fail: the steepness of the terrain, the type of soil, how much vegetation holds the ground together, the amount of rainfall, proximity to roads (where construction has destabilized slopes), and even the geological structure of the rocks beneath the surface.
In the Himalayas, for instance, landslides are often rockfalls triggered by steep slopes, rapid river erosion, and intense rainfall. The sedimentary rocks are prone to breaking down, and rivers cut away at the base of slopes, removing support. Meanwhile, in the Western Ghats, the story is different. Here, basalt rocks have weathered into thick layers of soil called regolith. When heavy monsoon rains saturate this soil, it transforms into mudslides that can bury entire villages.
This complexity is why traditional methods, where experts assign weights to different factors based on their judgment, often fall short. What works in one region might not work in another.
Enter Machine Learning and Teaching Computers to Recognize Patterns
This is where the IIT Delhi team’s approach becomes revolutionary. Instead of relying on expert judgment alone, they let the data speak for itself using machine learning, a form of artificial intelligence that learns patterns from examples.
Here’s a simple analogy: imagine teaching a child to recognize different types of fruits. You don’t give them a rulebook listing every characteristic of every fruit. Instead, you show them many examples—”this is an apple, this is an orange, this is a banana”—and their brain learns to recognize patterns. Machine learning works similarly.
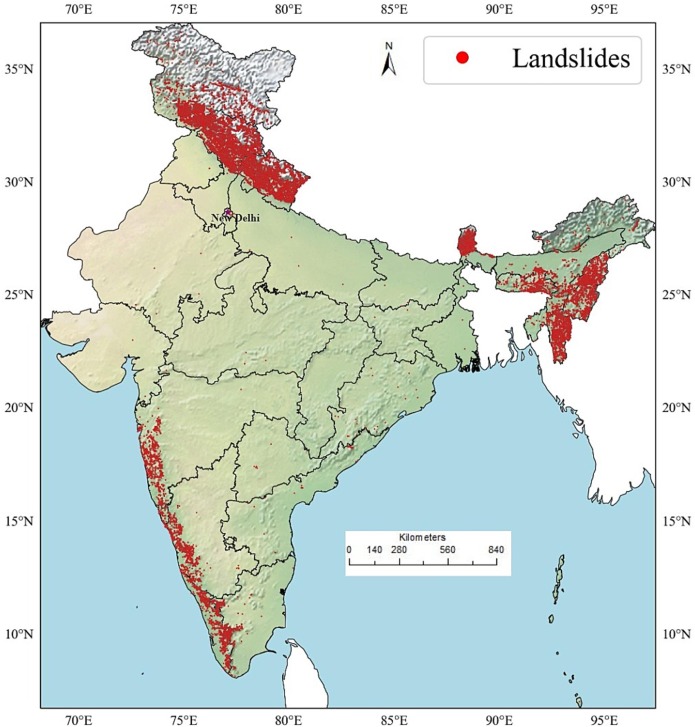
The researchers fed their computer models information about 154,329 landslide locations across India, along with 16 different environmental factors for each location, elevation, slope, soil type, rainfall, distance from roads and rivers, vegetation cover, and more. The algorithms learned to identify the conditions that make landslides likely.
The Data Challenge: Finding a Needle in a Haystack
But there was a significant problem to solve first. Landslides, while devastating, are relatively rare events. When the researchers divided India into 100-meter grid squares, only a tiny fraction contained landslides, creating what’s called an “imbalanced dataset.” It’s like trying to learn to identify a rare bird species when 99% of your photos are of common sparrows.
If you train a model on such imbalanced data, it becomes lazy. It learns to predict “no landslide” almost everywhere because that’s correct most of the time, achieving high accuracy while completely missing the rare but critical landslide-prone areas. This would be useless for disaster prevention.
The team tackled this with sophisticated resampling techniques. They used a method called One-Sided Selection (OSS) to remove redundant “no landslide” data points while keeping the important ones near the decision boundaries. Think of it as removing duplicate photos from your collection while keeping the unique and informative ones.
Then they used Support Vector Machine Synthetic Minority Oversampling Technique (SVMSMOTE), quite a mouthful!—to generate synthetic examples of landslide conditions. This is like creating realistic but artificial photos of that rare bird by intelligently blending features from the few real photos you have, helping the model learn better.
The Ensemble Approach
Rather than relying on a single machine learning model, the researchers combined three different approaches, each with its own strengths:
- Random Forests: This technique creates hundreds of decision trees, each trained on slightly different subsets of data, then averages their predictions. It’s like consulting a committee of experts who’ve each studied different aspects of the problem.
- Artificial Neural Networks (ANN): Inspired by how neurons in the brain connect and process information, these models can capture complex, non-linear relationships between factors. They excel at finding subtle patterns that simpler models might miss.
- Support Vector Machines (SVM): These models find the optimal boundary between landslide and non-landslide conditions by transforming the data into higher dimensions. Imagine being unable to separate two groups of points on a flat piece of paper, but if you lift the paper and fold it in three dimensions, the separation becomes clear.
By combining all three using a “blending ensemble” approach, they created a model that’s more robust and accurate than any single method. When the three models disagree, a final “meta-model” (logistic regression) weighs their inputs to make the best decision.
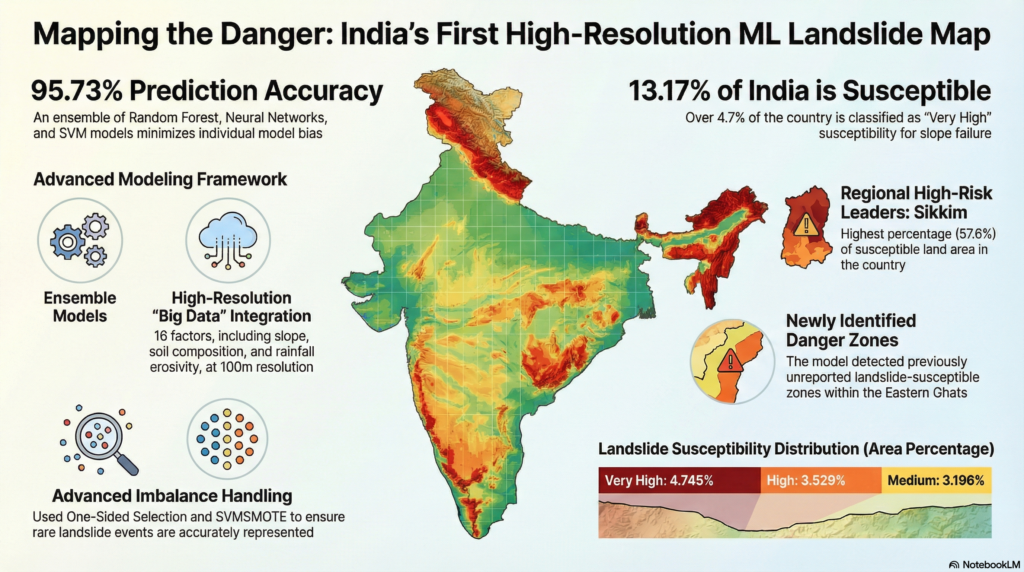
The results were impressive: 95.73% accuracy overall, 97.08% sensitivity (ability to correctly identify actual landslides), and a Matthews Correlation Coefficient of 0.915 (a measure that’s particularly good for imbalanced datasets). These numbers mean the model is genuinely good at predicting landslides, not just appearing accurate by predicting “no landslide” everywhere.
The 16 Factors That Matter Most
One fascinating insight from the research is understanding which factors matter most for predicting landslides. The Random Forest model revealed that slope angle is the single most important factor—steeper slopes are more prone to failure, as you’d intuitively expect.
But the second most important factor might surprise you: the Topographic Wetness Index (TWI), which indicates where water accumulates on the landscape. Water is the great destabilizer—it adds weight to soil, reduces friction between particles, and increases pressure within the ground. Areas where water collects are natural landslide zones.
Elevation ranked third, reflecting how different mountain regions have different landslide characteristics. The distance from roads also proved critical, a sobering reminder that human development, particularly road construction that involves cutting into hillsides, significantly increases landslide risk. In Sikkim, for example, most landslides occur in urban areas, attributed to rapid infrastructure development.
Interestingly, the research incorporated the rainfall erosivity factor, a measure of the kinetic energy of falling rain, which is often overlooked in landslide studies. When heavy raindrops pound the ground, they dislodge soil particles and increase erosion, making slopes less stable. This factor proved important enough that the researchers advocate for including it in future regional studies.
A Map That Reveals Hidden Dangers
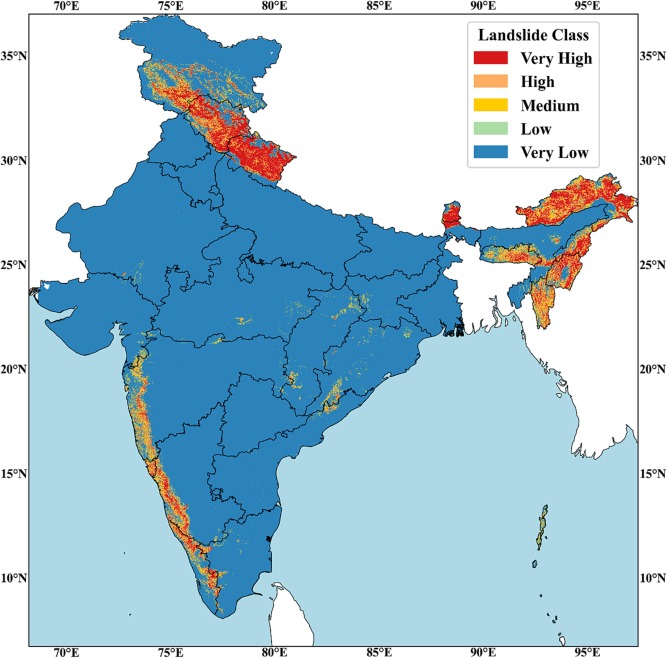
The resulting India Landslide Susceptibility Map (ILSM) divides the country into five categories: very low, low, medium, high, and very high susceptibility. The findings align with what we know about India’s landslide hotspots, the Himalayas and Western Ghats dominate the high-risk zones.
Sikkim emerged as the most vulnerable state, with 57.6% of its area susceptible to landslides. If you’ve driven through Sikkim’s winding mountain roads, this won’t surprise you, the terrain is spectacularly beautiful but treacherously unstable. Arunachal Pradesh has the largest total area at risk (31,845 km²), while Kerala leads among non-Himalayan states, with nearly 30% of its area in high or very high susceptibility zones.
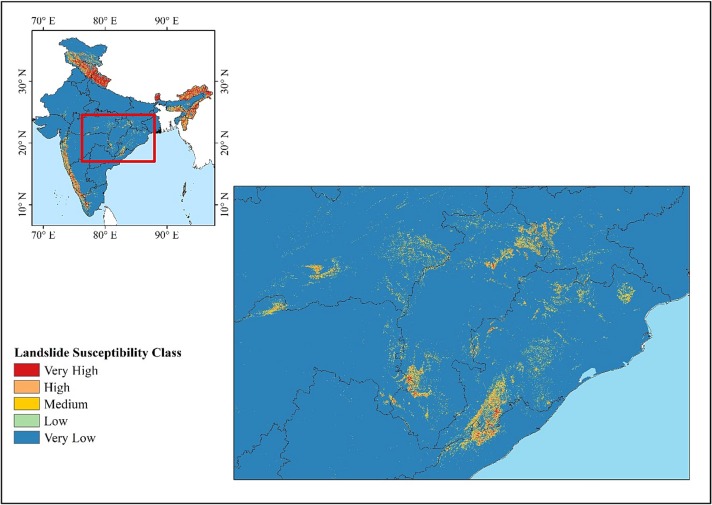
But here’s where the map revealed something unexpected: new landslide zones in the Eastern Ghats. These areas along India’s eastern coast hadn’t been identified in previous government landslide maps. When the researchers cross-checked with global landslide databases, they found evidence confirming that landslides do indeed occur in these regions—they’d just been overlooked.
This discovery highlights the power of the machine learning approach. By learning from landslide patterns across the entire country, the model could identify similar conditions in areas that hadn’t been surveyed on the ground. It’s like a doctor who, after seeing thousands of patients, can spot symptoms of a disease in a new patient that less experienced doctors might miss.
The Technical Innovation That Made It Possible
What makes this research particularly significant is not just the map itself, but the methodology behind it. The framework they developed can be applied to other countries or regions with similar challenges. It’s especially valuable for developing nations where ground survey data is limited, but satellite imagery and computer power are increasingly accessible.
The researchers used the MERIT Digital Elevation Model, which provides accurate terrain data by combining multiple satellite sources. They incorporated India’s newly developed road database—1,027,269 roads meticulously mapped under government directives—marking the first time such detailed road network data has been used for landslide susceptibility studies. This matters because roads are major landslide triggers, and having accurate data makes a huge difference.
They also developed the map at 0.001-degree resolution (approximately 100 meters on the ground), much finer than previous national-scale maps. This resolution means you can identify individual slopes at risk rather than just general regions.
Conclusion
This research represents a shift in how we approach natural hazards. Rather than reacting after disasters strike, we’re moving toward anticipating them. The combination of big data—landslide inventories, high-resolution terrain models, climate data, infrastructure maps—with sophisticated machine learning creates tools that were impossible just a decade ago.
The Indian Landslide Susceptibility Map is now freely available through Google Earth Engine and other platforms, making it accessible to researchers, government agencies, and even curious citizens. This openness means the work can be validated, improved, and applied by others around the world.
As climate change increases rainfall intensity in many regions and development pushes into mountainous areas, landslide risk is growing. Maps like the ILSM won’t prevent landslides—that’s often impossible given the terrain—but they can prevent tragedies by ensuring we build smarter, prepare better, and protect communities more effectively.
The next time you see a “Landslide Zone” sign on a mountain road, you might think about the complex interplay of geology, rainfall, vegetation, and human activity that creates that risk—and about how computers, trained on vast datasets, are learning to predict where the next sign should be placed.
From a devastating disaster in Uttarakhand to a comprehensive national map, India is transforming how it approaches landslide risk. And with similar techniques being applied globally, we’re moving toward a future where fewer people are caught off guard when hillsides start to move.
Reference
- Sharma, N., Saharia, M., & Ramana, G. V. (2024). High resolution landslide susceptibility mapping using ensemble machine learning and geospatial big data. Catena, 235, 107653. https://doi.org/10.1016/j.catena.2023.107653