

Imagine waking up one morning in Beijing, a city full of history and life. You look out your window and see a thick haze hanging over the skyline, hiding the tall buildings. The sun can barely shine through, and you feel frustrated by the pollution. You grab your phone and open Sina Weibo, which is like Twitter in China, to share your thoughts. You type, “Another day of toxic air! Can’t even see the sun. #BeijingSmog.”
What you might not know is that this simple post helps with something big: keeping track of air quality. Air pollution is a serious problem affecting millions of people around the world, causing health issues and early deaths. Usually, air quality is measured using expensive stations, which are often hard to find, especially in poorer countries.
But what if social media could help? A 2015 study by researchers at Wuhan University looked into this idea. They used posts from Sina Weibo to track air quality in Beijing. By analyzing what people were saying online about the air, they could figure out how the pollution levels were changing.
In this blog, we’ll explore how this interesting approach works. Your complaints about the smoggy air could actually help make a difference, giving important information that can lead to better air quality and healthier lives. This new way of using social media shows how we can all be part of solutions to environmental issues.
The research aimed to achieve two primary objectives: first, to investigate the connection between Sina Weibo posts regarding air pollution and the official Air Quality Index (AQI) data; second, to develop a predictive model for AQI based on social media activity. The team rigorously analyzed 179,316 geo-tagged posts from Beijing covering the years 2012 to 2013, carefully filtering out noise such as advertisements and mentions of indoor pollution.
They categorized the messages into three distinct types: retweets, which included celebrity-driven posts like “@CharlesXue: The government must act on pollution!”; mobile app messages that provided automated AQI updates, such as “Today’s AQI: 250 (Unhealthy)”; and original individual messages reflecting personal experiences, exemplified by sentiments like “My throat burns—this smog is brutal!”. By applying correlation analysis and machine learning techniques, the researchers uncovered significant patterns that highlighted the relationship between social media activity and air quality.
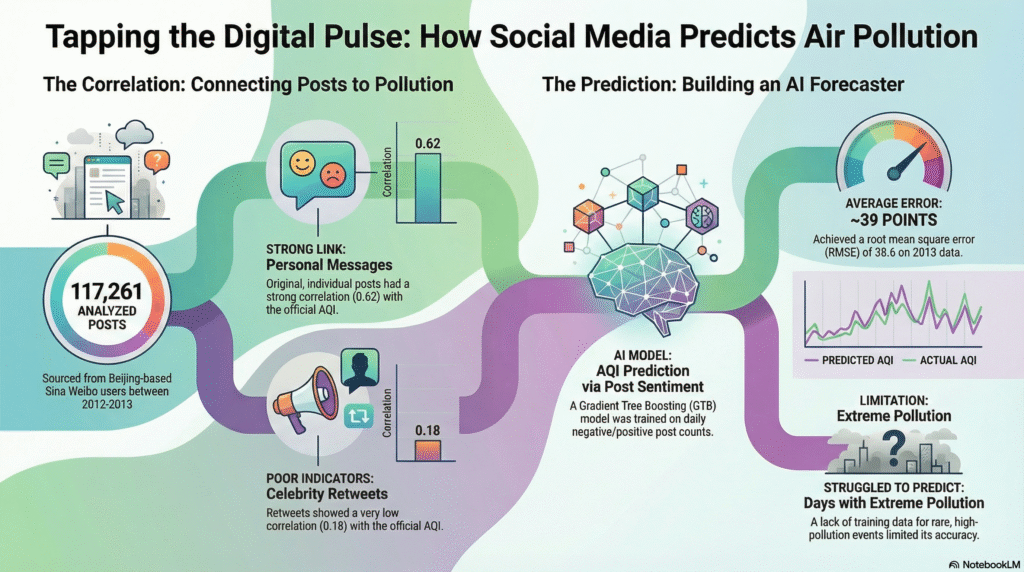
The data collection process, titled “Mining the Digital Pulse”, involved two main steps. In the first step, the team utilized Sina Weibo’s API alongside a custom web crawler to gather posts related to air pollution from users in Beijing. Despite efforts to filter by location, 40,364 posts from non-Beijing users were inadvertently included and were subsequently removed. The second step focused on refining the data to enhance its relevance. The team filtered out indoor pollution mentions, such as references to “formaldehyde in my apartment,” advertisements identified by specific symbols, and posts from non-Beijing users based on their registration profiles. After this rigorous process, they retained 117,261 posts, with individual messages, making up 15.83% of the total, proving to be the most valuable for their analysis.
The categorization of messages related to air quality reveals intriguing patterns in their correlations with air quality index (AQI) levels. First, retweets, particularly from celebrities, often serve to amplify calls for government action; however, they tend to have a low correlation with AQI fluctuations, as evidenced by viral posts that can skew data even on clear days. On the other hand, messages generated by mobile apps, while providing real-time AQI levels, tend to be redundant for prediction since they inherently contain AQI data. Yet, pollution alerts indicating serious pollution levels show a strong correlation with days of poor air quality.
Most notably, original individual messages emerge as valuable insights; personal posts such as “Bought 10 masks this week!” or “Sky’s gray again” offer raw, emotional reflections that are strongly tied to AQI fluctuations. When filtering out overly positive comments, like “Air’s better after rain!”, the correlation between these authentic expressions and AQI levels significantly increases, highlighting their potential as key indicators for understanding public perceptions of air quality.
A correlation analysis explored the link between daily post volume and the air quality index (AQI), with the team calculating Pearson correlation coefficients (r) for various message types during 2012. The results indicated a moderate overall correlation of 0.57 for all messages; however, filtering out less relevant content revealed a stronger correlation of 0.62 for individual messages.
In stark contrast, retweets displayed a low correlation of only 0.18. A significant peak was noted in January 2012, where the correlation surged to 0.75, coinciding with an AQI spike of 269 and a rise in posts. Conversely, in July 2012, the correlation dropped to 0.08 as improved air quality from rain led to a surge in positive posts, obscuring the relationship. This analysis underscores the critical role of negative posts, as frustration typically escalates with pollution levels. Despite being labour-intensive, manually filtering out positive content greatly improved the analysis’s accuracy.
The study employed Gradient Tree Boosting (GTB), a powerful machine learning technique that improves the prediction accuracy of weaker models, especially decision trees, by merging them into a stronger ensemble. This approach parallels a group of experts working together to refine their forecasts: the initial decision tree provides an estimate, and the subsequent trees aim to correct any errors from earlier models, continuing this process until overall prediction inaccuracies are reduced.
For predicting the Air Quality Index (AQI), the model used two main inputs: the daily number of negative individual posts and the daily number of positive individual posts. The model was trained with data from 2012, during which the team fine-tuned three important hyper-parameters: a low learning rate of 0.01 to allow the model to adapt gradually, 400 trees to boost accuracy while mitigating overfitting, and a tree depth of 7 to control individual tree complexity.
The results from 2013 were encouraging, with an R² value of 0.59 demonstrating a reasonable fit for real-world data and a root mean square error (RMSE) of 38.6, reflecting an average prediction error of around 39 AQI points. While the model outperformed previous techniques, it struggled on days with extreme pollution, such as January 2013 when AQI hit 500, because of inadequate training data for those unusual high-pollution scenarios.
Exploring digital monitoring via social media brings various challenges and a broader perspective for public health advocacy. A major obstacle is the decline of Sina Weibo, as users shift to WeChat, which lacks public APIs, putting future data collection at risk. Additionally, user location ambiguity complicates analysis; posts can originate from various locations within a city like Beijing, leading to geolocation inaccuracies. Automating sentiment analysis is another hurdle; the current manual process of classifying posts as positive or negative proves unsustainable, underscoring the need for natural language processing tools designed specifically for the Chinese language.
Furthermore, ethical dilemmas emerge regarding the use of public posts without user consent, even with anonymized data, necessitating clearer research ethics guidelines. Despite these challenges, research suggests a transformative vision where social media could be a viable public health tool globally. By utilizing low-cost monitoring methods, real-time alerts could be generated based on surges in health-related posts, such as mentions of masks or coughs. This approach could be adapted for various platforms globally, from Twitter in Delhi to Instagram in Los Angeles. Future efforts should concentrate on enhancing training data to encompass extreme pollution events, integrating weather data to assess its impact on the air quality index (AQI) and social media postings, and conducting cross-platform analyses that synchronize Weibo, news content, and satellite data to develop a comprehensive understanding of public health trends.
In conclusion, when you next tweet about smog, keep in mind the influence of your words. A recent study reveals that social media acts not just as an echo chamber but also as a sensor network that captures our shared air quality. Despite the challenges that remain, the synergy between big data and environmental science provides a spark of optimism. As the study’s authors observe, “The filtered messages are strongly correlated to AQI… a new way to monitor air pollution.” In a world where nine out of ten people breathe polluted air, it is essential for everyone to take part—every contribution, whether a hand or a tweet, matters in the quest for cleaner air.
Reference
Jiang W, Wang Y, Tsou MH, Fu X. Using Social Media to Detect Outdoor Air Pollution and Monitor Air Quality Index (AQI): A Geo-Targeted Spatiotemporal Analysis Framework with Sina Weibo (Chinese Twitter). PLoS One. 2015 Oct 27;10(10):e0141185. doi: 10.1371/journal.pone.0141185. PMID: 26505756; PMCID: PMC4624434.
Sakaki T, Okazaki M, Matsuo Y. Earthquake shakes Twitter users: real-time event detection by social sensors. In: Proceedings of the 19th international conference on World wide web. North Carolina:Raleigh;2010. pp. 851–860. https://doi.org/10.1145/1772690.177277712
Wei Y, Ye X. Urbanization, urban land expansion and environmental change in China. Stoch Environ Res Risk Assess. 2014;28(4):757–765.
Wang S, Paul MJ, Dredze M. Social Media as a Sensor of Air Quality and Public Response in China. Journal of Medical Internet Research. 2015;17(3):e22.
Kaplan AM, Haenlein M. The early bird catches the news: Nine things you should know about micro-blogging. Business Horizons. 2011;54(2):105–113. : http://dx.doi.org/10.1016/j.bushor.2010.09.00424.
Boyd D, Golder S, Lotan G, editors. Tweet, Tweet, Retweet: Conversational Aspects of Retweeting on Twitter. In: Proceedings of the 2010 International Conference on System Sciences. Hawaii:Honolulu;2010. pp. 1–10. https://doi.org/10.1109/HICSS.2010.41234