

Soil is composed of organic matter, minerals, water, air, and living organisms. It serves as a habitat for microorganisms, a medium for plant growth, and a foundation for various ecological processes. Due to hydrological, geological, and biological cycles, soil is constantly changing and evolving.
Soil has several important functions, including being a source of raw materials, producing biomass, transforming nutrients, providing a physical and cultural environment for humans, and acting as a carbon pool.
Soil erosion is a significant concern and poses a universal threat to the environment. It leads to land degradation, reduced soil fertility, and sedimentation. Underdeveloped countries often experience high rates of soil erosion due to factors such as lack of vegetation cover, intense ploughing, and excessive grazing. In contrast, developed countries tend to experience soil erosion primarily due to heavy machinery use.
Gully erosion is a highly destructive form of soil erosion that significantly impacts natural resources, agriculture, and infrastructure. A gully is defined as a deep channel formed by concentrated water flow that removes surface soil and parent material, making it much larger than what can be effectively managed by standard tillage operations. Gullying occurs when the geomorphological threshold is exceeded due to sediment erodibility or the erosivity of flowing water. To prevent such occurrences, continuous monitoring is essential. This can be achieved by creating susceptibility maps to better understand the gully erosion mechanism and identify areas that are particularly vulnerable to erosion.
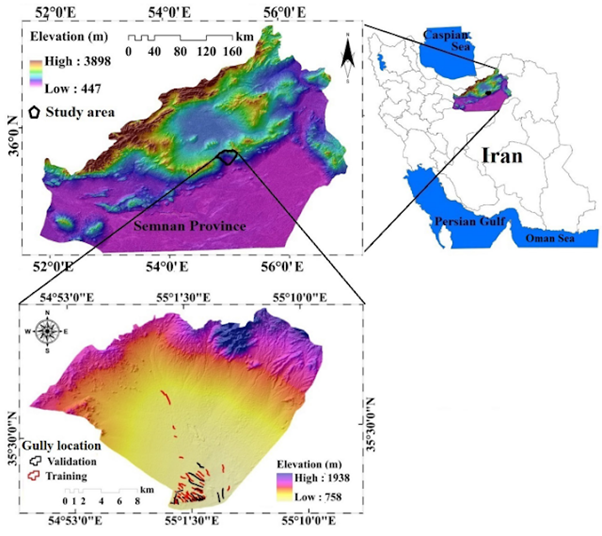
A team of researchers from Iran and South Korea conducted a study to predict gully soil erosion in Semnan Province, Iran. They used several methods, including frequency ratio (FR), weights-of-evidence (WofE), index of entropy (IOE), and the Analytic Hierarchy Process (AHP). They generated a gully erosion susceptibility map (GESM) using GIS-based models.
The study area predominantly features gullies in the southern regions, which are primarily a result of human activities and the area’s erosion sensitivity. The researchers created a Gully Inventory Map (GIM) through extensive field surveys using a GPS device and Google Earth imagery. They identified a total of 80 gullies, of which 53 were V-shaped and 27 were U-shaped. The maximum and minimum depths of the identified gullies were 13.5 meters and 1.5 meters, respectively, while the maximum and minimum widths were 21 meters and 2.1 meters, respectively.
The Analytic Hierarchy Process (AHP) leverages expert knowledge to conduct pairwise comparisons, facilitating the assignment of decision-making weights. The Frequency Ratio (FR) method evaluates the relationship between dependent variables, such as gully inventory, and independent geo-environmental variables. The Index of Entropy (IOE) serves to quantify disorder and uncertainty within systems, thereby identifying key variables that influence various phenomena. Furthermore, the Weight of Evidence (WofE) model employs Bayesian probability to assess the impact of various factors on gully erosion through an analysis of the presence or absence of gullies.
The researchers compiled a dataset comprising 80 samples, encompassing 13 factors: elevation, slope degree, slope aspect, plan curvature, distance from the river, drainage density, distance from the road, lithology, land use/land cover, topographic wetness index (TWI), stream power index (SPI), normalized difference vegetation index (NDVI), and slope length (LS). For the purpose of modelling, the dataset was partitioned into 70% for training and 30% for testing.
Prior to conducting the analysis, 18 factors were assessed for multicollinearity using Variance Inflation Factor (VIF) and Tolerance (TOL) metrics. Specifically, a TOL value of = 0.1 and a VIF value >= 10 indicate the presence of multicollinearity among the independent variables. Based on the results of this assessment, 13 factors were selected for further analysis, as outlined above. Additionally, thematic layers were prepared and categorized into various classes to facilitate the analysis.
The study involved the evaluation of four models: Analytic Hierarchy Process (AHP), Factor Rating (FR), Weight of Evidence (WofE), and Index of Evidence (IOE). The equations developed for AHP, FR, WofE, and IOE are presented in Equations (1), (2), (3), and (4), respectively.
AHP = [(elevationw × 0.085) + ( slopew × 0.176) + ( aspetw × 0.019) + ( plan curvaturew × 0.015) + ( dis streamw × 0.024) + ( drinage densityw × 0.052) + ( dis roadw × 0.067) + ( lithologyw × 0.226) + ( LCw × 0.085) + ( TWIw × 0.012) + ( SPIw × 0.04) + ( NDVIw × 0.137) + ( LSw × 0.031)] (1)
FR = [(elevationFR) + ( slopeFR) + ( aspetFR) + ( plan curvatureFR) + ( dis streamFR) + ( drinage densityFR) + ( dis roadFR) +( lithologyFR) + ( LU/LCFR) + ( TWIFR) +( SPIFR) + ( NDVIFR) + ( LSFR)]. (2)
WofE = [(elevationWofE) + ( slopeWofE) +( aspetWofE) + ( plan curvatureWofE) +( dis streamWofE) + ( drinage densityWofE) +( dis roadWofE) + ( lithologyWofE) +( LU/LCWofE) + ( TWIWofE) + ( SPIWofE) +( NDVIWofE) + ( LSWofE)]. (3)
IOE = [(elevationw × 0.71) + ( slopew × 0.23) +( aspetw × 0.38) + ( plan curvaturew × 0.31) +( dis streamw × 0.04) +( drinage densityw × 0.39) +( dis roadw × 0.60) + ( lithologyw × 1.79) +( LU/LCw × 3.86) + ( TWIw × 0.79) +( SPIw × 0.25) + ( NDVIw × 22.79) +( LSw × 0.07)]. (4)
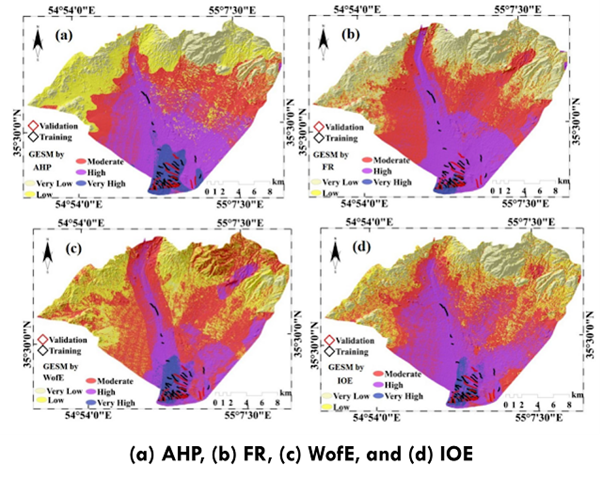
The susceptibility maps generated in this study were categorized into five classifications: very low, low, moderate, high, and very high.
For the Analytic Hierarchy Process (AHP) model, the classification of the study area revealed the following distribution: 17.5% classified as very low, 22.86% as low, 25.49% as moderate, 28.31% as high, and 5.58% as very high.
In the case of the Frequency Ratio (FR) model, the classifications were as follows: 25.82% very low, 10.62% low, 35.94% moderate, 26.38% high, and 1.24% very high.
The Weight of Evidence (WOfE) model classified the study area with 5.10% in the very low category, 30.40% in the low category, 43.67% moderate, 17.13% high, and 3.70% very high.
Lastly, the Index of Entropy (IOE) model presented the following classification: 16.75% very low, 18.48% low, 32.51% moderate, 29.76% high, and 2.51% very high.
The maps generated in this study were evaluated using Receiver Operating Characteristic (ROC) curves. The results indicate that the Analytical Hierarchy Process (AHP) demonstrated superior performance with an Area Under the Curve (AUC) of 0.954, compared to other models such as Frequency Ratio (FR) at 0.912, Index of Entropy (IOE) at 0.939, and Weight of Evidence (WofE) at 0.926. Furthermore, the study employed the Seed Cell Area Index (SCAI) validation technique to analyze the density of gullies within landslide susceptibility zones. It was observed that the high and very high susceptibility classes generally correspond with lower SCAI values. The findings suggest that the SCAI values across the four models are particularly favourable within the high and very high susceptibility classifications.
Validation results indicated that the gully erosion susceptibility maps created by four models demonstrate strong predictive efficiency. These maps are valuable tools for planners, decision-makers, and engineers, enabling them to make informed decisions to minimize damage from existing and future gullies by implementing appropriate preventive and mitigation measures.
Reference
Arabameri, A., Rezaei, K., Pourghasemi, H.R. et al. GIS-based gully erosion susceptibility mapping: a comparison among three data-driven models and AHP knowledge-based technique. Environ Earth Sci 77, 628 (2018). https://doi.org/10.1007/s12665-018-7808-5
USDA-SCS (1966) Procedure for determining rates of land damage, land depreciation, and volume of sediment produced by gully erosion. Technical Release No. 32. US GPO 1990-261-419:20727/SCS.US Government Printing Office, Washington, DC.
Rahmati O, Tahmasebipour N, Haghizadeh A, Pourghasemi HR, Feizizadeh B (2017) Evaluating the influence of geo-environmental factors on gully erosion in a semi-arid region of Iran: An integrated framework. Sci Total Environ 579:913–927.