Total Dissolved Solids (TDS) refers to the quantity of dissolved materials, including salts and organic matter. Various factors contribute to increased TDS levels in water, such as sediments, urban runoff, municipal waste, chemical substances, organic carbon, ion desorption, mineral dissolution, temperature changes, and the decomposition of rocks. Elevated TDS levels can cause corrosion and scaling in cooling systems and boilers. TDS is vital for assessing water quality, affecting aspects like taste, corrosiveness, and its suitability for drinking and irrigation. High TDS levels may stem from both natural sources and human activities, including urban runoff, industrial discharges, and agricultural practices. The U.S. Environmental Protection Agency (EPA) recommends a limit of 500 mg/L for drinking water to mitigate issues such as pipeline scaling and potential health risks.
The determination of Total Dissolved Solids (TDS) can be conducted via direct or indirect methods. The direct method involves grab sampling, where water samples are collected and analyzed by filtrating, oven-drying, and weighing residues. Indirect determination can be done by summing concentrations of constituents or measuring electrical conductivity (EC), which is indicative of salinity. Water bodies are classified based on TDS concentrations: freshwater (<1000 mg/L), brackish (1000-10,000 mg/L), saline (10,000-100,000 mg/L), and brine (>100,000 mg/L).
TDS affects lake mixing and stratification, with increased levels delaying spring turnover and enhancing thermal stratification, which can lead to ecosystem disruption. Many studies indicated that higher salt loading affects mixing dynamics in lakes like Mendota and Monona. Additionally, microorganisms can influence TDS levels, and microbial earthworm ecofilters (MEEs) have shown significant potential in reducing TDS concentrations in treated water.
TDS (Total Dissolved Solids) analysis is essential for understanding water quality, especially in groundwater and assessing seawater intrusion. However, measuring TDS in the field is more challenging, costly, and time-consuming compared to EC (Electrical Conductivity) measurement, which is easier and can be done with portable devices. Consequently, many studies rely on estimating TDS through correlations with EC, assuming a linear relationship based on ionic dissolved solids. It’s important to note that this relationship may not be linear, as it can vary depending on the water’s salinity and its material composition.
This article presents a study conducted by a team of researchers from the University of Nevada, Las Vegas, focusing on the prediction of total dissolved solids (TDS) in Lake Mead, located in the Colorado River, USA. The findings were published in the Journal of Water in 2023. The research employs nine machine learning techniques, including Artificial Neural Networks (ANN), Support Vector Machines (SVM), K-Nearest Neighbors (KNN), Random Forest (RF), linear regression, bagging, XGBoost, extra trees, and gradient boosting machines.
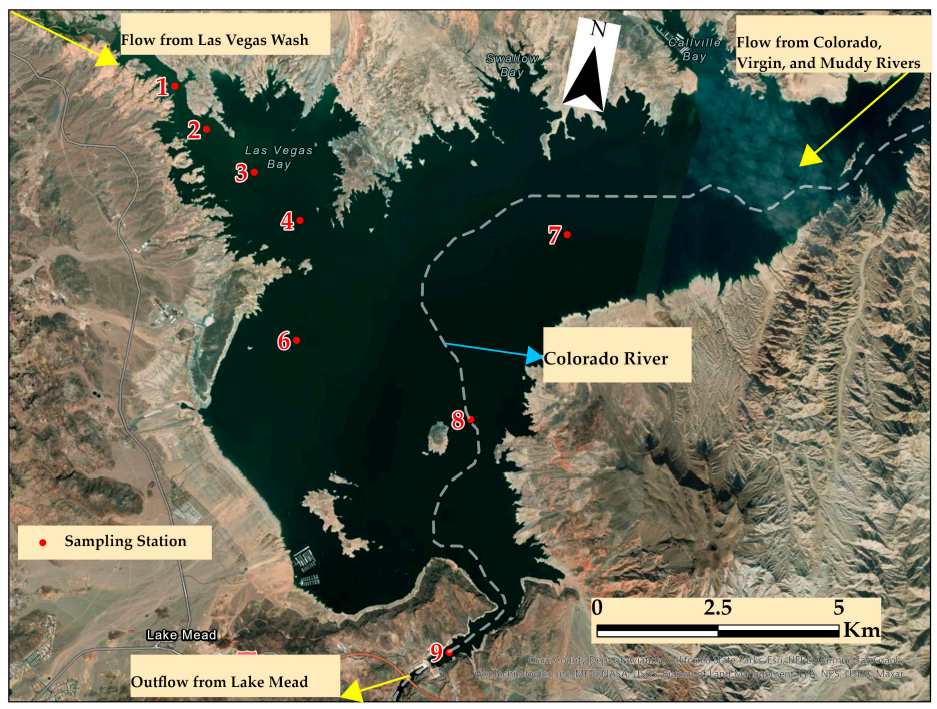
Lake Mead, situated in the Mojave Desert within the Arizona-Nevada region, serves as a vital water source for the Las Vegas Valley. However, it faces significant challenges due to TDS, which adversely affects water quality. The TDS loadings into the lake originate from several sources, including the mainstem Colorado River, Little Colorado River, Virgin River, Muddy River, and the Las Vegas Wash. The natural TDS concentration in Lake Mead is approximately 610 mg/L, which exceeds the Environmental Protection Agency’s recommended limit of 500 mg/L.
The increase in TDS levels is attributed to various factors, including the rising use of ion-exchange water softeners in the Las Vegas Valley, which discharge regenerant salts into the wastewater system. As the population continues to grow, projections indicate a potential 14% increase in TDS concentration in the Las Vegas Wash by 2035, unless appropriate mitigative measures are implemented.
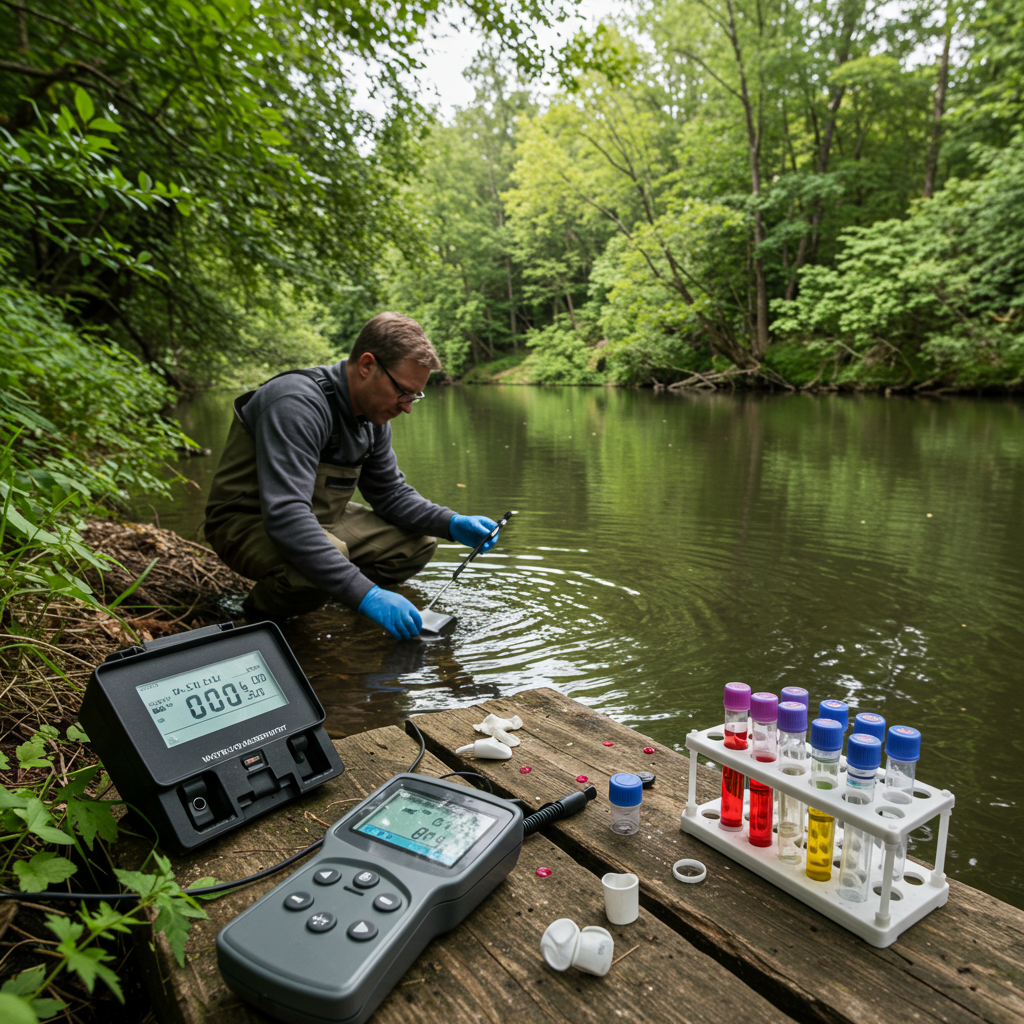
The researchers conducted a data collection study in the city of Las Vegas. Samples were collected annually from various locations in the lake, focusing on total dissolved solids (TDS), electrical conductivity (EC), and temperature. A summary of the collected data is presented in Table below. Temperature and EC measurements were obtained using a YSI EXO data sonde, while TDS concentrations were analyzed in the laboratory at the Clark County Wastewater Facility in Nevada, USA, through gravimetric methods that included physical filtering and drying procedures.
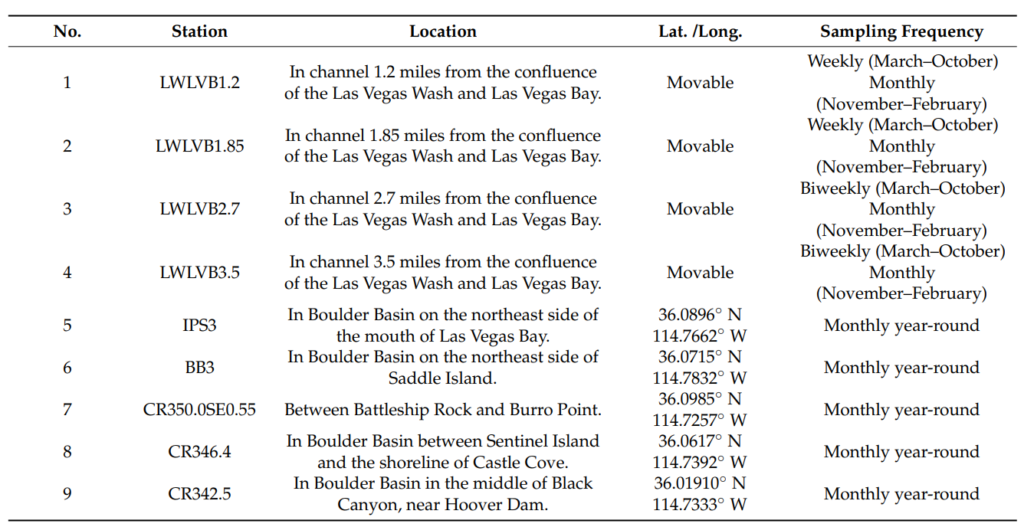
The measurement frequency and locations were selected based on background information and their relevance to the study objectives. Additionally, the researchers compiled a consolidated database for analysis employing the aforementioned machine learning techniques. The optimal hyperparameter settings for the models were determined using the grid search technique, a computation-intensive process that thoroughly explores all possible combinations to identify the best hyperparameter values.
To address potential overfitting in the model, k-fold cross-validation was implemented. This technique involves a splitting process that allows the training phase to be repeated, thereby enhancing the robustness of the machine learning algorithm. The optimal hyperparameter settings are as follows:
For Linear Regressor (LR), Fit Intercept = false
For Support Vector Machine (SVM), Kernel = linear; C=1; gamma=0.1
For K-Nearest Neighbor (KNN), number of neighbors = 10; weights = uniform
For Artificial Neural Network (ANN), hidden layer sizes = 100; activation = ReLU
For Bagging, number of estimators = 20
For Gradient Boosting Machine (GBM), learning rate = 0.1; number of estimators = 100.
For Extra Trees (ET), number of estimators = 100.
For Random Forest (RF), number of estimators = 100.
For XGBoost. learning rate = 0.1; maximum depth = 3.
The study indicated that the Gradient Boosting Machine (GBM) model, with an R-squared value of 0.87, outperformed the other models evaluated. This superior performance can be attributed to its ability to capture complex relationships by iteratively constructing trees and learning from the errors produced by weaker predecessors. These findings underscore the reliability and efficiency of the GBM in estimating Total Dissolved Solids (TDS) from Electrical Conductivity (EC) and temperature measurements.
Furthermore, the study has demonstrated that machine learning (ML) models, particularly ensemble methods, are highly effective in estimating TDS based on EC and temperature data. This innovative methodology presents a cost-effective and rapid alternative to traditional laboratory-based TDS measurements. Water resource managers can utilize these models to monitor TDS levels in real-time, identify trends, and anticipate future changes in water quality.
By adopting such approaches, proactive measures can be taken to address challenges related to water quality, thereby promoting sustainable management of water resources. The integration of machine learning in water quality monitoring signifies a substantial advancement in environmental management practices. As technology progresses, these data-driven methodologies will play an increasingly crucial role in addressing global water quality issues.
Reference
Adjovu, G. E., Stephen, H., & Ahmad, S. (2023). A machine learning approach for the estimation of total dissolved solids concentration in lake mead using electrical conductivity and temperature. Water, 15(13), 2439.https://doi.org/10.3390/w15132439
EPA. National Primary Drinking Water Guidelines; U.S. EPA: Washington, DC, USA, 2009. Available online: https://www.epa.gov/sites/production/files/2016-06/documents/npwdr_complete_table.pdf
Shareef, M.A.; Toumi, A.; Khenchaf, A. Estimating of Water Quality Parameters Using SAR and Thermal Microwave Remote Sensing Data. In Proceedings of the 2nd International Conference on Advanced Technologies for Signal and Image Processing (ATSIP), Monastir, Tunisia, 21–23 March 2016; pp. 586–590
Chapter 5—Sampling. In NPDES Compliance Inspection Manual; U.S. Environmental Protection Agency: Washington, DC, USA, 2017. Available online: https://www.epa.gov/sites/default/files/2017-03/documents/npdesinspect-chapter-05.pdf