

The article presents a study conducted by Saurabh Kumar Anuragi and D. Kishan from the Department of Civil Engineering at Maulana Azad National Institute of Technology, Bhopal, India. This research focuses on the development of landslide susceptibility maps utilizing various machine learning techniques specifically for the Sikkim region of India.
Landslides represent a significant threat to human life, infrastructure, and the environment, particularly in the mountainous terrain of Sikkim. The state’s intricate topography, combined with high seismic activity and heavy monsoon rainfall, makes it susceptible to frequent landslide events. It is essential to identify areas prone to landslides in order to ensure public safety and mitigate the economic impacts on both regional and national levels.
The assessment of landslide susceptibility zones and the creation of accurate and up-to-date susceptibility maps have become critical areas of research in the field of hazard management. Advanced geospatial technologies and machine learning algorithms are proving to be indispensable tools for evaluating landslide susceptibility and addressing the associated risks effectively.
Landslide susceptibility mapping (LSM) identifies regions at risk of landslides by examining various environmental and topographical factors. The main goal of landslide assessment is to develop susceptibility maps that offer spatial and temporal predictions of landslides on a regional level. These maps are essential for disaster management, urban development, and infrastructure planning. By incorporating remote sensing data with machine learning models, professionals can produce more precise and dependable maps that highlight high-risk areas.
Many earlier studies employed statistical methods such as frequency ratio (FR), index of entropy (IOE), weight of evidence (WoE), analytical hierarchy process (AHP), and information value to create LSM for various regions using remote sensing and GIS data. Furthermore, combining soft computing techniques like random forest (RF), xgboost, ngboost, and neural networks has enhanced the models’ accuracy and reliability. These sophisticated approaches integrate multiple algorithms simultaneously, improving the assessment process and yielding more trustworthy results.
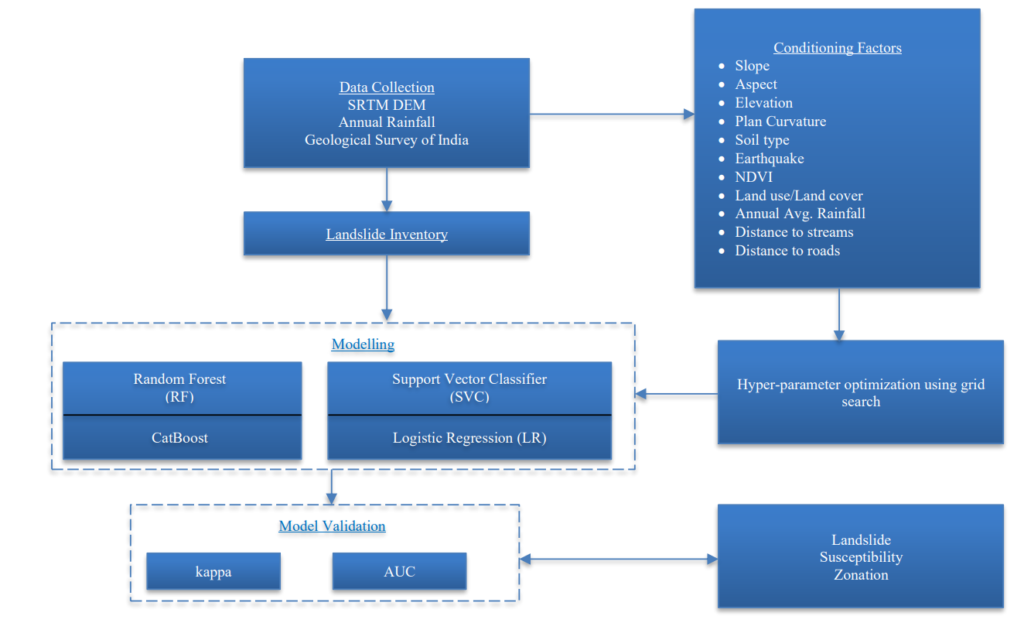
Consequently, this study applies logistic regression (LR), random forest (RF), support vector classifier (SVC), and catboost while considering eleven landslide conditioning factors (LCFs) as follows:
- Slope – Steep slopes increase the likelihood of landslides.
- Aspect – The direction a slope faces affects soil moisture and erosion.
- Elevation – Higher altitudes may experience more weathering and instability.
- Land Use & Land Cover (LULC) – Human activities like deforestation and construction affect soil stability.
- Distance to Roads – Areas near roads are more prone to erosion and instability.
- Distance to Streams – Proximity to water bodies influences soil saturation and erosion.
- Normalized Difference Vegetation Index (NDVI) – Measures vegetation density, which affects soil stability.
- Plan Curvature – Determines how water flows and accumulates on slopes.
- Soil Type – Different soil compositions have varying susceptibility to landslides.
- Rainfall – High precipitation weakens soil and triggers landslides.
- Seismic Activity – Earthquakes can destabilize slopes, increasing landslide risks.
The authors gathered landslide data from Bhukosh (Geological Survey of India), comprising 693 landslide samples and 695 non-landslide samples. Before conducting the analysis, the dataset was split into 70% for training and 30% for testing. Additionally, the optimal hyperparameters for the machine learning models were determined using a grid search technique.
The models’ performance was assessed with various metrics, such as kappa score, sensitivity, specificity, and Area Under the Curve (AUC). Among the models evaluated, Random Forest (RF) stood out as the top performer, achieving a kappa score of 0.519 and an AUC of 0.756. It recorded the least misclassification rate, with 889 errors, outperforming Logistic Regression (LR), which had the most errors at 966, and both Support Vector Classifier (SVC) and CatBoost, which had 929 and 897 errors, respectively. CatBoost closely followed with an AUC of 0.762, demonstrating strong predictive capabilities and an effective handling of categorical variables. SVC also exhibited competitive accuracy, with an AUC of 0.753, but demanded more computational resources. Finally, while Logistic Regression was straightforward, it had the lowest AUC at 0.743 and struggled with complex geospatial interactions, rendering it the least appropriate choice for landslide mapping. Overall, the findings suggest that RF is the most dependable model for practical applications.
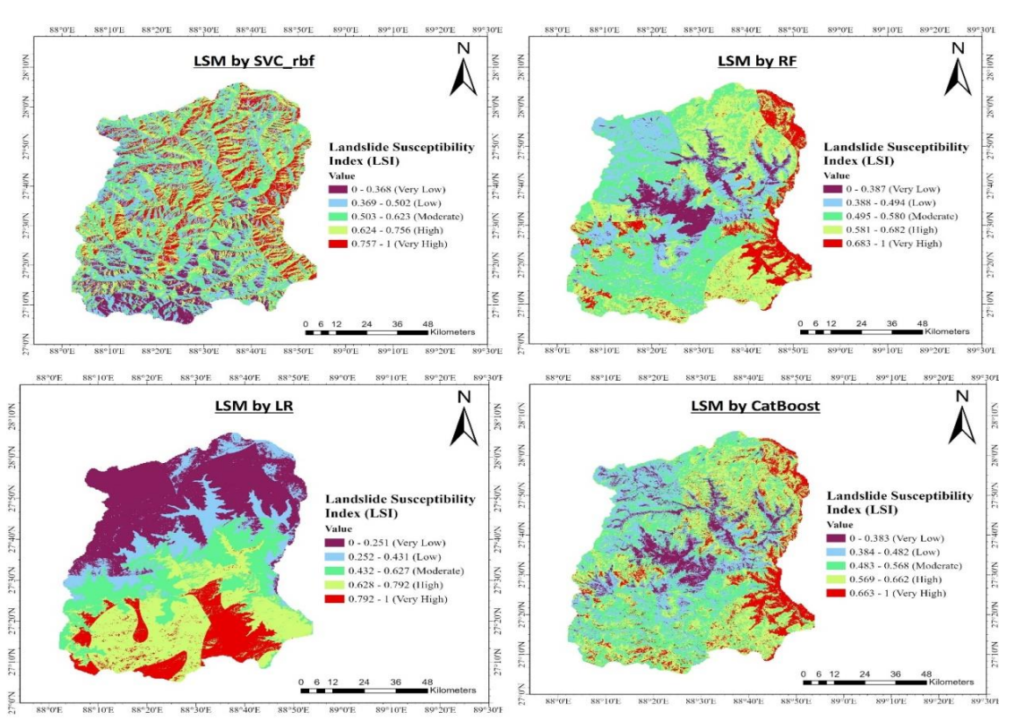
The final generated map was divided into five classes based on landslide susceptibility index (LSI):
- Very Low Risk – Minimal chances of landslides occurring.
- Low Risk – Some risk, but not critical.
- Moderate Risk – Areas that may experience occasional landslides.
- High Risk – Significant probability of landslides occurring.
- Very High Risk – Most vulnerable areas requiring urgent attention.
The Landslide Susceptibility Index (LSI) value ranges from 0 to 1, where a value of 0 signifies an area with a very low probability of landslides, while a value of 1 indicates a very high probability of landslides. Based on the LSI, the spatial distribution for each model was established. For the CatBoost model, the zone with the lowest contribution is classified as ‘Very Low’ at 9.2%, while the zone with the highest contribution is categorized as ‘Moderate’ at 30.68%. For the Random Forest (RF) model, the ‘Very Low’ zone contributes 8.31%, and the ‘Moderate’ zone contributes 30.49%. In the case of the Logistic Regression (LR) model, the lowest contributing zone is ‘Very High’ at 11.9%, and the highest is ‘Very Low’ at 31.92%. For the Support Vector Classification (SVC) model, the ‘Very Low’ zone contributes 10.72%, whereas the ‘High’ zone contributes 26.01%. Among all models evaluated, RF and CatBoost have identified the largest areas classified under moderate-risk zones, which provides valuable insights for disaster preparedness initiatives.
The Random Forest model has emerged as the most effective technique due to several significant advantages. Its high prediction accuracy distinguishes it, enabling reliable outcomes across various scenarios. Additionally, its ability to manage nonlinear relationships renders it versatile for differing data types. The model also demonstrates robustness in the presence of missing data, ensuring the integrity of predictions is preserved. Furthermore, Random Forest excels in generalization, meaning it can effectively leverage its learning when applied to previously unseen data, thus serving as a powerful tool for predictive analytics.
This study’s findings offer crucial insights for various stakeholders in urban development and disaster management. Urban planners can use this data to create infrastructure that minimizes landslide vulnerability, promoting safer living conditions. Government agencies can apply these insights to develop comprehensive land use and disaster response policies, thereby enhancing community safety. Furthermore, local communities can identify high-risk areas, enabling them to implement preventive measures and prepare for potential landslides effectively. Collaboration between these entities is essential for building resilient urban environments.
Landslide susceptibility mapping, utilizing geospatial data and machine learning, serves as a key tool in reducing landslide risks in Sikkim and other mountainous regions. Of the four models evaluated, Random Forest emerged as the most effective in accurately identifying landslide-prone regions. These insights will contribute to improved planning, preparedness, and risk reduction strategies, ultimately protecting lives and infrastructure.
Reference
Saurabh Kumar Anuragi, D. Kishan. (2024).Geospatial and Machine Learning Techniques for Landslide Risk Mapping in Sikkim, India, International Journal of Recent Engineering Science, 11(6), 187-197. https://doi.org/10.14445/23497157/IJRES-V11I6P116
Chen, W., Fan, L., Li, C., & Pham, B. T. (2019). Spatial prediction of landslides using hybrid integration of artificial intelligence algorithms with frequency ratio and index of entropy in nanzheng county, china. Applied Sciences, 10(1), 29. https://doi.org/10.3390/app10010029
Biswakarma, P., Barman, B. K., Joshi, V., & Rao, K. S. (2020). Landslide susceptibility mapping in east Sikkim region of Sikkim Himalaya using high resolution remote sensing data and GIS techniques. Appl. Ecol. Environ. Sci, 8(4), 143-153. https://pubs.sciepub.com/aees/8/4/1/
Kavzoglu, T., & Teke, A. (2022). Predictive Performances of ensemble machine learning algorithms in landslide susceptibility mapping using random forest, extreme gradient boosting (XGBoost) and natural gradient boosting (NGBoost). Arabian Journal for Science and Engineering, 47(6), 7367-7385. https://doi.org/10.1007/s13369-022-06560-8